
Reach was not the commercial result
The fashion brand was reaching millions of people, but only a small share returned to buy. Buying more traffic would have amplified the same uncertainty. The business needed to understand where suitable visitors stopped, what evidence might explain that friction and which change deserved a controlled test.
My scope connected cross-channel retargeting with website acquisition and engagement tracking, session recordings, heatmaps, creative testing and multivariate landing-page tests. My verdict is that paid media and store conversion have to share one purchase question. Advertising creates and recaptures attention; the store must then help a suitable customer understand, trust and complete the decision.
This case is distinct from the purchase-cost recovery case, which starts with a media-efficiency spike. It also differs from the buyer-profile case, which starts with customer evidence and journey planning. This page addresses the gap between substantial paid reach and completed onsite purchases.
What the documented fashion case shows
The approved portfolio case covers a US women's fashion brand across January 2022 to December 2023. The comparison records growth across the lower funnel: add-to-cart actions increased 36.7%, purchases increased 45.3% and overall conversion rate increased 23.7%.
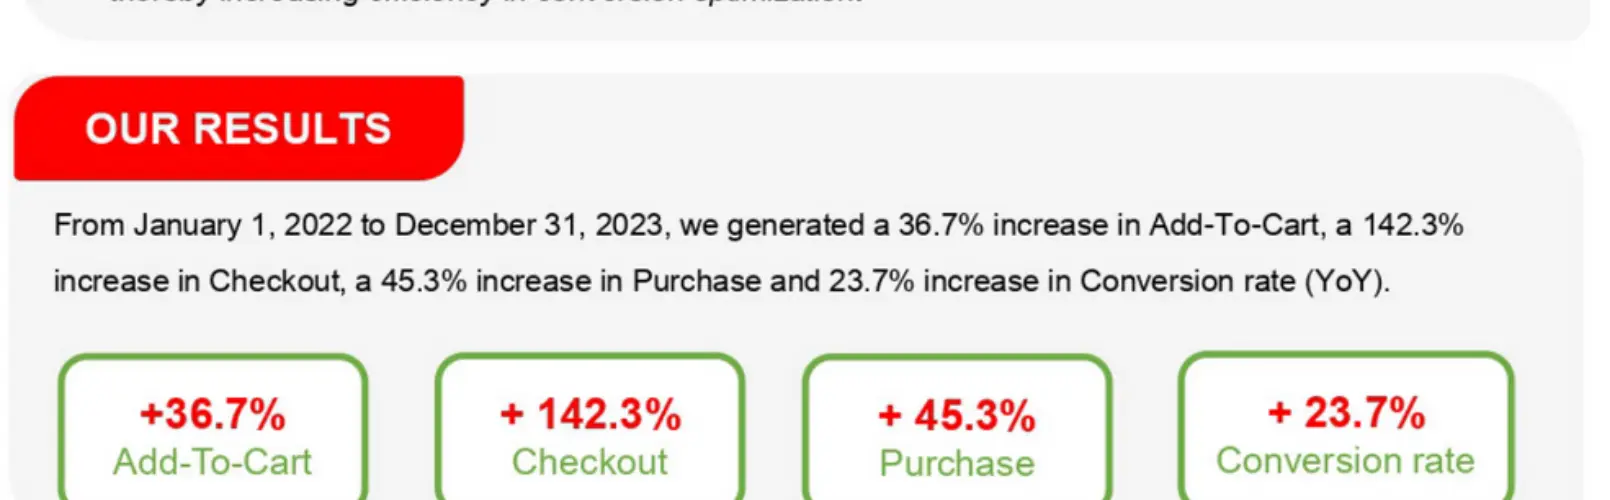
The source records 36.7% add-to-cart growth, 45.3% purchase growth and a 23.7% conversion-rate increase. These are historical comparison results, not a forecast.
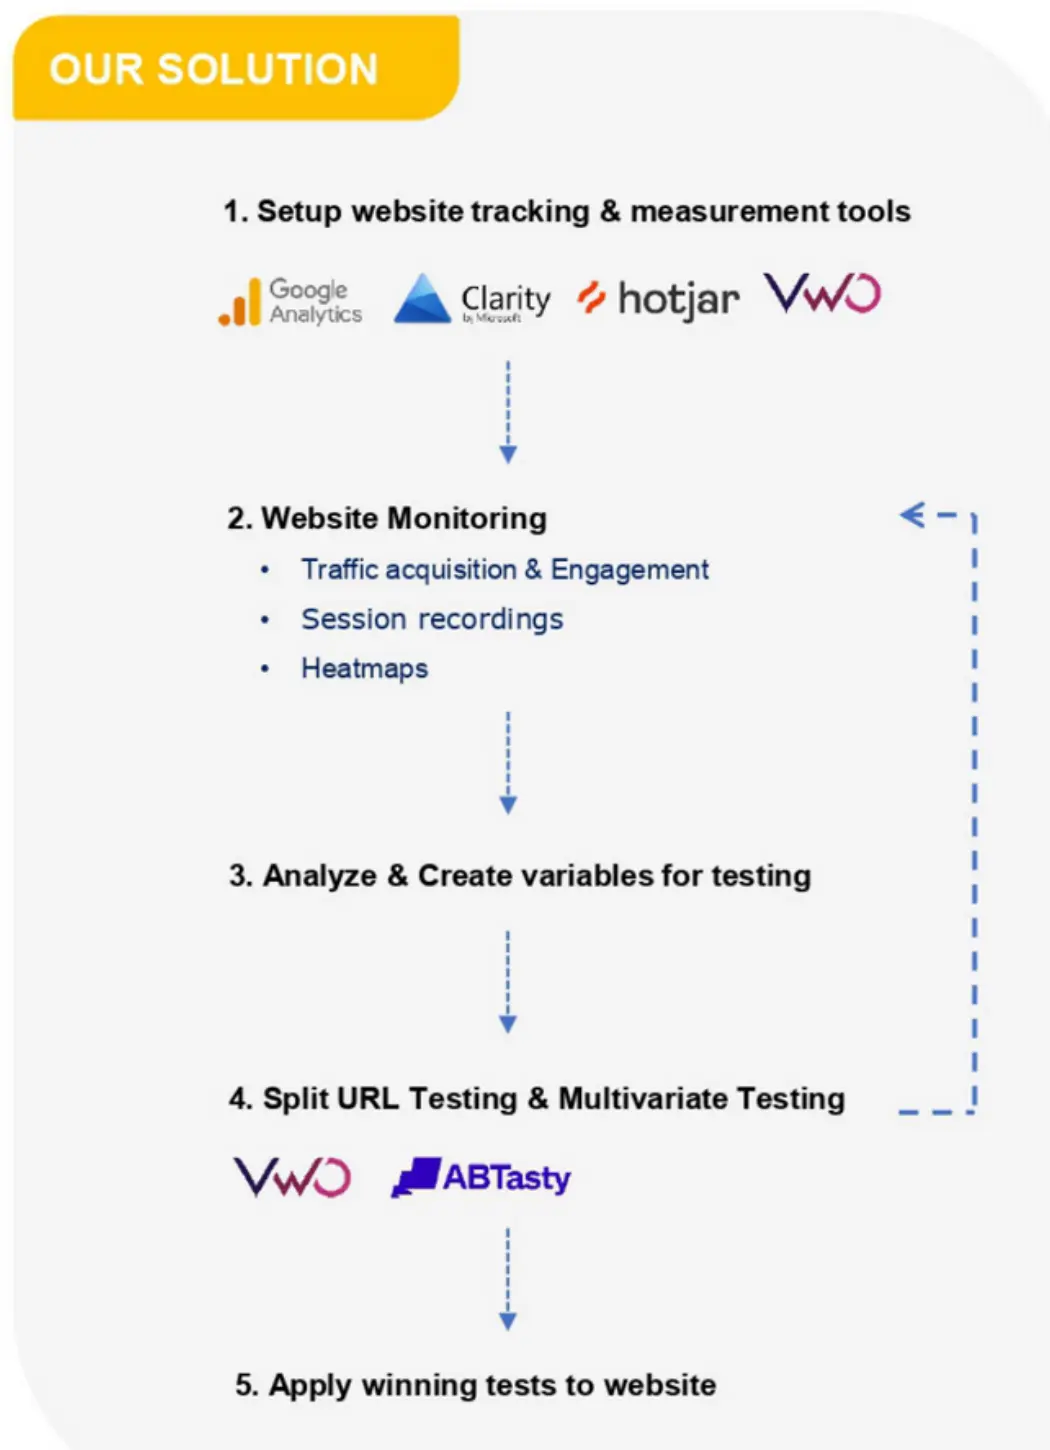
The source documents website tracking, monitoring, session recordings, heatmaps, creative testing and multivariate landing-page tests alongside retargeting activity.
The evidence has important limits. The source does not provide absolute sessions or orders, media spend, revenue, contribution, returns, customer mix, sample size or attribution rules. It does not isolate the effect of retargeting from site changes, creative, merchandising, wider team work or market conditions. The case therefore does not claim sole causation, incrementality or a universal conversion benchmark.
Four lessons I would carry into the next ecommerce engagement
1. Diagnose the first broken purchase step
Google Analytics defines the standard purchase journey as session, product view, add to cart, begin checkout and purchase. That sequence helps locate the first visible loss. It does not explain the cause, but it stops an owner using one blended conversion rate to diagnose every problem.
2. Observe behaviour before inventing a redesign
Microsoft Clarity describes heatmaps as aggregated click and scroll evidence, while recordings reconstruct individual sessions from page and interaction events. I use both to form hypotheses: a missed delivery promise, repeated interaction with a non-clickable element, a mobile defect or important information positioned too late. Observation directs the test; it is not proof by itself.
3. Test one material decision
A conversion programme becomes unreadable when a new promotion, page layout, audience, creative concept and measurement change happen together. Name the customer obstacle, the page or journey step, the expected behaviour and the commercial success rule before making the change.
4. Reconcile purchases with business value
Google Analytics ecommerce reports depend on correctly sent events such as add-to-cart and purchase. Even accurate events do not show the full commercial result. Leadership still needs store orders, cancellations, returns, discounts, margin, stock and customer mix before scaling the winning route.
The Reach-to-Purchase Experiment Loop
I use this six-stage loop to keep media and site decisions accountable. It is an owner-level operating model, not a requirement for the owner to configure analytics or run tests personally.
Confirm the purchase record
Align platform, analytics and store evidence for the same dates, markets and order status.
Find the first material loss
Separate suitable sessions, product views, carts, checkout starts and completed purchases.
Inspect customer behaviour
Use segmented recordings, heatmaps, feedback and technical checks to collect possible explanations.
Name the decision barrier
State which customer question or friction the proposed change should resolve and for whom.
Run one controlled change
Protect the comparison from simultaneous campaigns, promotions, page edits and tracking changes.
Judge commercial value
Compare mature purchase evidence with contribution, returns, stock and customer quality before scaling.
The loop can end with keep, revise, stop or inconclusive. An inconclusive result is not a failure when it prevents a weak decision from becoming a permanent site change.
Use the evidence pattern to choose the next move
| Observed pattern | Likely constraint to test | Owner decision | Avoid |
|---|---|---|---|
| Paid reach grows; suitable product views do not | Audience, creative promise or landing relevance | Repair the acquisition-to-page match | Redesigning checkout first |
| Product views hold; add-to-cart progression weakens | Product fit, value, proof, variants or delivery clarity | Test the highest-confidence product-page barrier | Adding more traffic to the same uncertainty |
| Carts increase; purchases do not | Checkout, total price, payment, delivery or technical friction | Inspect checkout behaviour and failed transactions | Calling carts a commercial win |
| Purchases rise; contribution or retention weakens | Discount, product mix, returns or customer quality | Hold scale and repair economics | Treating conversion rate as profit |
| Purchases and verified contribution improve | A supported route to growth | Scale in a controlled step with a stop rule | Assuming the next increment behaves identically |
An illustrative owner review
Illustrative example — not client proof or a benchmark
| Same eligible sessions | Before | Test period | Decision |
|---|---|---|---|
| Product viewers who add to cart | 600 | 700 | Selected product-page barrier may have improved |
| Checkout starts | 300 | 350 | Progression moved with carts |
| Completed purchases | 180 | 210 | Verify order quality, margin and returns before scaling |
The example deliberately keeps eligible sessions fixed to make the logic legible. A real test needs an agreed inclusion rule, normal buying cycle, technical validation and protection from major promotions or traffic-mix changes. The right evidence threshold belongs to the business; these figures are not recommendations.
If traffic is present but revenue is not, use the Traffic-to-Revenue Diagnosis. If sales rise while profit falls, use the ecommerce profit bridge. For implementation context, review growth partnership services, Meta Ads support, landing-page support, conversion tracking, the original case context, evidence standards and how I work directly.
Sources and evidence notes
Sources and current search results were checked on 24 September 2026. Search priority is qualitative; no unverified keyword volume, universal conversion benchmark or guaranteed test duration is claimed. Case metrics are reproduced from approved anonymised portfolio evidence with the limitations stated above. The Reach-to-Purchase Experiment Loop, decision matrix and illustrative review are original ThomPerformance practitioner analysis.
Frequently asked questions
What does this ecommerce conversion case study prove?
The approved portfolio record reports 36.7% growth in add-to-cart actions, 45.3% growth in purchases and a 23.7% increase in conversion rate across the stated comparison period. It documents the work and observed outcomes, but does not disclose absolute totals, spend, margin, attribution or a controlled counterfactual.
Should an ecommerce owner improve traffic or conversion first?
Find the first material constraint. If suitable paid sessions are scarce, demand may be the problem. If product views, carts or checkouts stall despite relevant traffic, investigate the store journey. If purchases rise but contribution weakens, repair economics before increasing either traffic or conversion activity.
Are heatmaps and session recordings proof of why customers do not buy?
No. They are behavioural evidence that can reveal missed information, repeated clicks, scrolling patterns or technical friction. They do not reveal a visitor's full motivation or prove causation. Use them to form testable hypotheses, then compare completed purchases and commercial outcomes.
Does a higher ecommerce conversion rate always mean better growth?
No. Conversion rate can improve because of discounts, returning-customer mix, low-value products or changes in traffic composition. Review revenue, contribution after advertising, new-customer mix, returns, stock and fulfilment beside the rate before calling the change commercially successful.
How long should an ecommerce conversion test run?
There is no responsible universal duration. The test needs enough eligible traffic, completed purchase evidence and time to cover the business's normal buying cycle without mixing major promotions or site changes. Set the decision rule before launch and record when evidence remains inconclusive.
Turn the next reach decision into a purchase experiment
This case does not say that heatmaps, retargeting or a landing-page test will create the same result for another store. It shows why customer acquisition and onsite conversion should share one evidence loop. Reconcile the outcome, locate the first loss, observe before changing, isolate one hypothesis and verify the commercial value.
Where does your current journey lose the most confidence: product view, cart, checkout, purchase or post-purchase economics?