E-commerce conversion solution
Your ads are getting clicks. The store is not getting sales.
Find whether the loss begins with traffic quality, the creative-to-product-page handoff, product confidence, checkout friction or broken measurement.
Best suited to e-commerce brands spending $3K+/month · Direct with Thomas · No retainer pitchWhen e-commerce ads get clicks but no sales, do not rebuild the campaign first. Compare paid sessions from each promise and product against view-content, add-to-cart, checkout and purchase progression. The first abnormal drop identifies whether to change traffic, message, product-page evidence, checkout or tracking.
Client evidence · Fashion e-commerce
Paid traffic and onsite conversion were treated as one system.
In an anonymised US fashion case from my portfolio, website measurement, session analysis, heatmaps and multivariate testing were connected to acquisition. The documented comparison records add-to-cart +36.7%, checkout +142.3%, purchases +45.3% and conversion rate +23.7% year over year.
Read the full client case →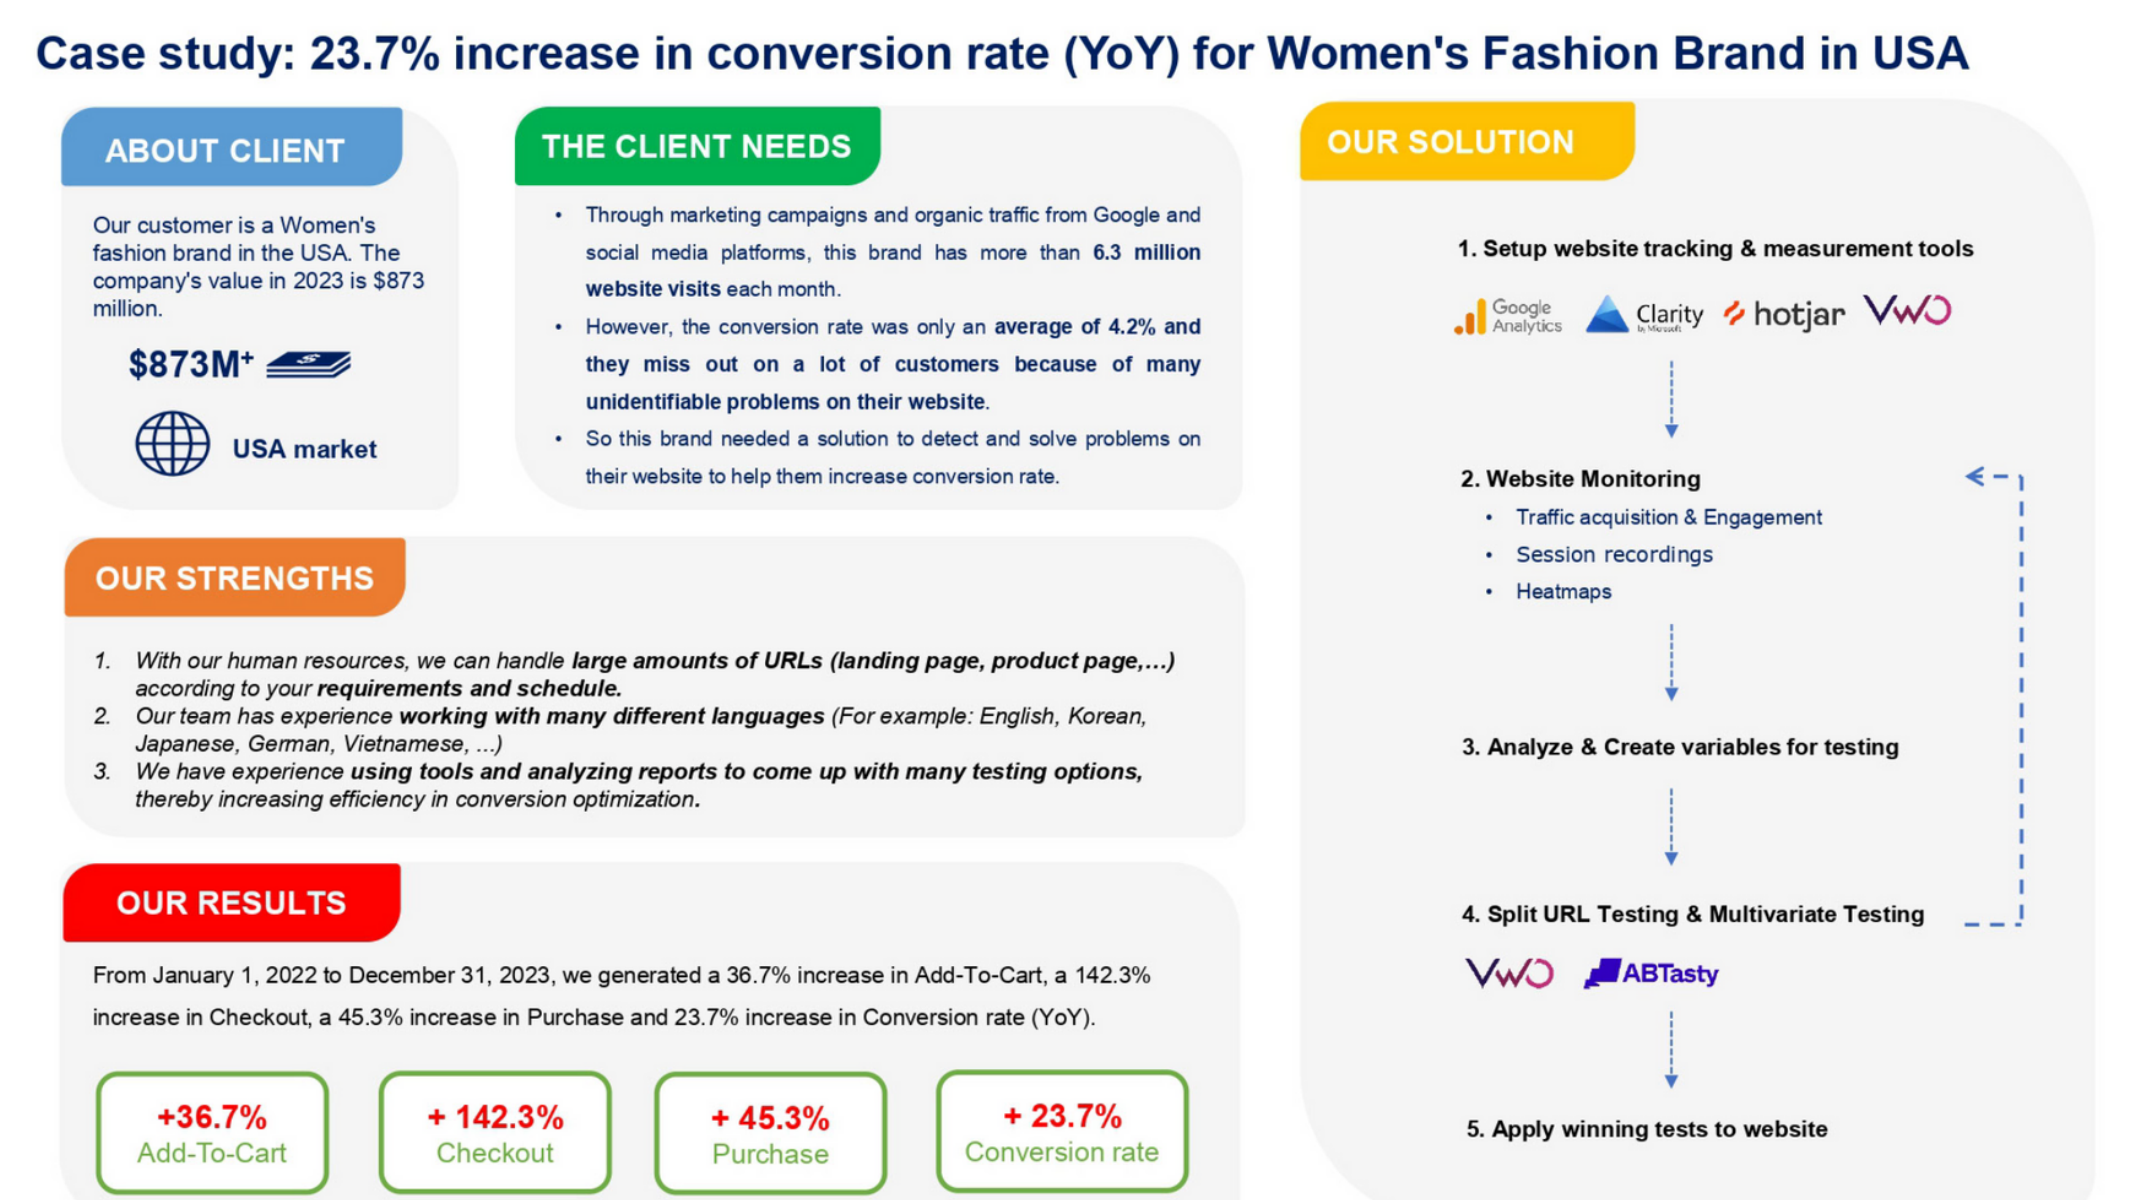
What this looks like
Recognise the symptom before choosing the fix.
Clicks arrive; product views do not
The landing destination, page speed, tracking or ad-to-page continuity may be losing visitors before they meaningfully inspect the product.
Product views rise; carts stay flat
The traffic may be curious rather than ready, or the page may not resolve value, fit, delivery, returns, trust and product-specific objections.
Carts grow; purchases do not
Unexpected shipping, weak payment options, discount dependence, mobile friction or checkout errors can turn apparent demand into abandonment.
What may be underneath
The ad account may be reporting the symptom—not the cause.
The ad earns attention from the wrong buying state
A strong hook can create inexpensive clicks from people who enjoy the creative but do not want the product, price or commitment being offered.
The product page breaks the promise made in the ad
The image, benefit, price or use case that earned the click is difficult to find after arrival, forcing the customer to restart the decision.
The page leaves purchase objections unresolved
Reviews, product detail, sizing, shipping, returns, guarantees and payment information appear too late or lack enough specificity to support action.
The funnel cannot distinguish loss from missing data
Duplicate events, consent gaps, cross-domain checkout or inconsistent purchase values make a real conversion problem look like a tracking problem—or the reverse.
How I diagnose it
Trace one commercial chain before changing everything.
- 01
Build the paid-session funnel
Compare landing sessions, product views, add-to-cart, checkout and purchase for the same date, channel, device, market and landing destination.
Evidence: Stage conversion rates, event diagnostics and drop-off by traffic source. - 02
Match each promise to its destination
Trace the exact ad angle, product and audience into the first screen of the landing experience. Check whether the page immediately continues the reason for the click.
Evidence: Creative-to-page message map and product-level conversion rate. - 03
Inspect behaviour at the first abnormal drop
Use recordings, heatmaps, page-speed evidence, checkout tests and customer questions only where the funnel shows a meaningful loss.
Evidence: Observed friction tagged by device, page and customer objection. - 04
Run one commercially guarded test
Change the smallest layer that can explain the break. Judge the test by purchase rate and contribution—not clicks or add-to-cart alone.
Evidence: Test hypothesis, primary metric, guardrail and minimum review window.
Decision map
Match the observed pattern to the first useful action.
| Observed pattern | What it may mean | First decision |
|---|---|---|
| Low landing-page arrival rate | Load, redirect or tracking failure | Repair the technical handoff before changing acquisition |
| Views but few carts | Traffic, offer or product-confidence problem | Test message continuity and product-specific proof |
| Carts but few checkouts | Price, shipping or commitment friction | Make total cost and next steps explicit earlier |
| Checkouts but few purchases | Payment or final-step friction | Test the complete mobile checkout and payment path |
| Purchases occur but analytics misses them | Measurement failure | Repair purchase events before reallocating spend |
This is a diagnostic map, not a universal benchmark. The correct decision depends on your offer, market, buying journey, data quality and starting point.
Free 48-hour written audit
What you receive.
For accounts spending $3K+/month, I review the available media, conversion and commercial context and return the three highest-impact opportunities. No commitment. No retainer pitch.
Request the diagnostic →- Paid-session funnel by channel, device and product
- Creative-to-product-page continuity review
- Product-page trust and objection map
- Checkout and purchase-event validation
- Three prioritised conversion tests with commercial guardrails
Best fit
This diagnosis works when evidence can change a decision.
Strong fit
- DTC and e-commerce brands with meaningful paid traffic
- Accounts spending $3K+/month
- A stable product, price and fulfilment process
- Access to ad-platform and store analytics
Not designed for
- Stores without enough sessions to identify a pattern
- Products with no validated demand or working checkout
- A request for a guaranteed conversion rate
- Teams unwilling to change the product or onsite experience
Practical questions
Questions that change the diagnosis.
Why are Facebook ads getting clicks but no sales?
Common causes are low purchase intent, a mismatch between the creative and product page, weak product proof, unexpected total cost, checkout friction or missing purchase tracking. The funnel stage where progression first drops should determine the first fix.
How do I know whether the ads or website are the problem?
Compare product-page arrival and purchase progression by campaign, creative, device and landing page. If one traffic source fails while the same page converts elsewhere, inspect intent and message. If every source fails at the same stage, inspect the onsite experience.
Should I optimise for add-to-cart before purchase?
Purchase should remain the commercial outcome when volume and tracking support it. Add-to-cart can diagnose intent, but optimising toward it can teach the platform to find people who start rather than complete the buying journey.
Will a new product page fix the problem?
Only when evidence points to the page. Rebuilding without knowing the failed stage can hide traffic-quality, pricing, checkout or measurement problems and reset useful learning.