High cost per lead solution
Your CPL is rising. Do not cut budget before finding out why.
Separate auction pressure from account waste, message fatigue, conversion friction and a deliberate shift toward better-quality demand.
Best suited to B2B teams spending $3K+/month · Direct with Thomas · No retainer pitchTo reduce a high cost per lead, decompose the change into media cost, click-through rate and landing-page conversion rate, then compare the same periods, audiences and conversion definitions. Remove measurable waste first. Do not optimise CPL downward when the higher-cost cohort produces better sales acceptance, opportunities or customers.
Client evidence · Meta Ads
Lead volume grew while CPL recovered.
In one anonymised Meta account from my work portfolio, monthly lead volume moved from roughly 600 to more than 1,100 while CPL finished around VND 0.84M—below the roughly VND 1.04M February peak.
Read the full client case →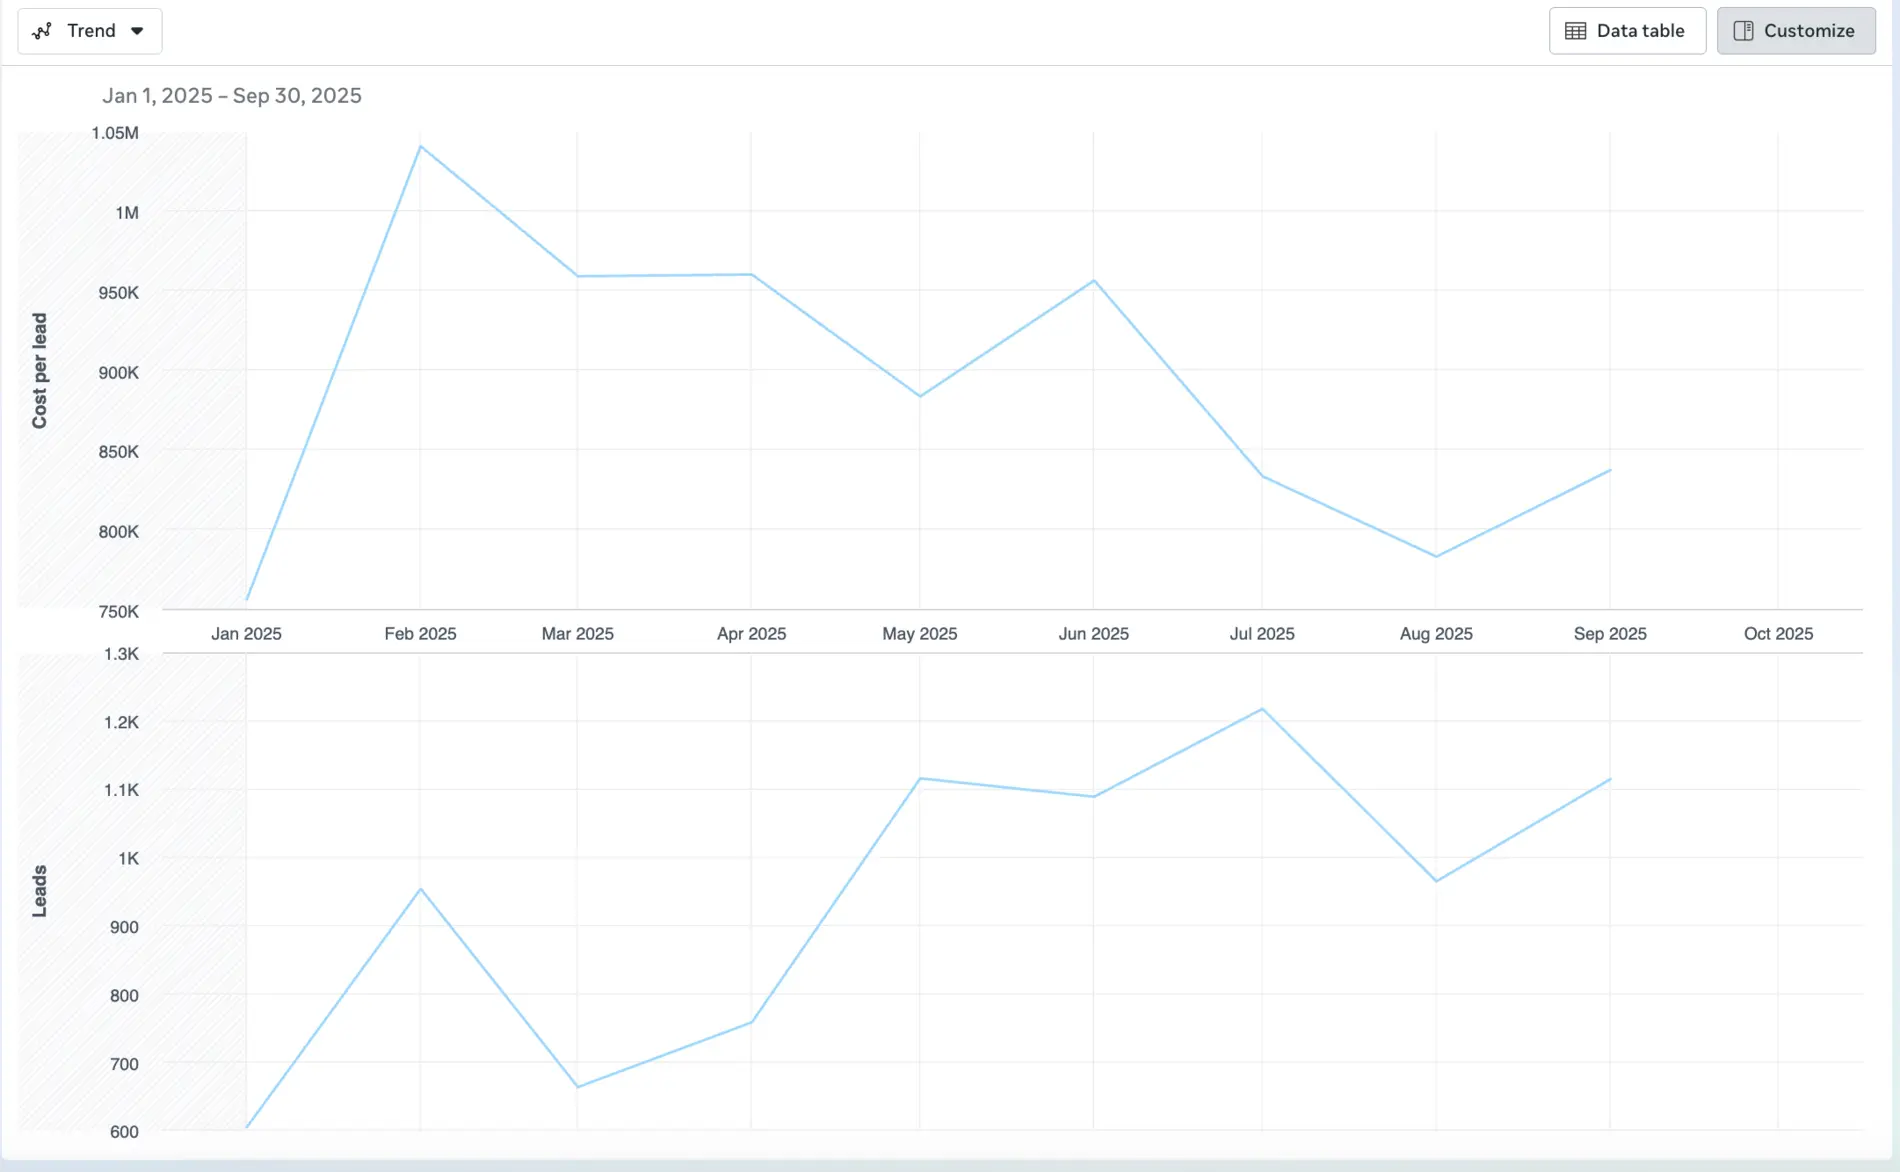
What this looks like
Recognise the symptom before choosing the fix.
Spend is stable; lead volume falls
The account may be paying more for the same reach, earning fewer clicks or converting a smaller share of visitors. Those are different problems.
Scaling makes each new lead more expensive
Additional budget moves beyond the strongest demand, audiences or creative before the account has earned a wider efficient market.
Teams chase last month’s CPL
A blended target hides seasonality, brand demand, market mix and whether the newer leads are commercially better or worse.
What may be underneath
The ad account may be reporting the symptom—not the cause.
The same impression or click costs more
Auction competition, audience saturation, geography and placement mix can raise CPM or CPC even when the message and landing page are unchanged.
Creative or search relevance has weakened
Falling click-through rate can indicate message fatigue, weaker intent coverage or expansion into people less likely to respond.
The post-click path loses more visitors
Message mismatch, form friction, mobile experience, tracking errors or a less compelling offer can reduce conversion rate and increase CPL.
The account is buying different demand
Brand, remarketing and high-intent sources often look cheaper than new-market or demand-creation activity. A blended CPL can punish the channels creating incremental growth.
How I diagnose it
Trace one commercial chain before changing everything.
- 01
Rebuild the metric equation
Compare CPM or CPC, click-through rate and landing-page conversion rate for equivalent dates, markets, devices and conversion actions.
Evidence: A component bridge showing exactly which factor created the CPL change. - 02
Separate demand types
Split brand from non-brand, retargeting from prospecting and mature markets from expansion. Do not let cheap captured demand subsidise weak acquisition.
Evidence: Spend, volume and qualified outcomes by demand role. - 03
Recover measurable waste
Review search terms, exclusions, PMax overlap, placements, creative fatigue, conversion actions and budget fragmentation before rebuilding the account.
Evidence: A quantified waste list with confidence level and owner. - 04
Check downstream quality
A CPL increase can be acceptable when sales acceptance, opportunity rate or customer cost improves. Judge the same acquisition cohort at a comparable age.
Evidence: Cost per accepted lead, opportunity and customer by source.
Decision map
Match the observed pattern to the first useful action.
| Observed pattern | What it may mean | First decision |
|---|---|---|
| CPM or CPC rises; response rates hold | Auction or mix pressure | Protect high-quality demand and test market, bid or placement boundaries |
| Click-through rate falls | Message fatigue or weaker relevance | Refresh the angle and query-to-offer alignment |
| Clicks hold; conversion rate falls | Landing path, offer or tracking problem | Audit message continuity, form, mobile experience and event accuracy |
| CPL rises; qualified cost improves | A better response mix | Do not reverse the change using CPL alone |
| CPL and qualified cost both rise | Real efficiency loss | Recover waste, repair the weakest component and retest |
This is a diagnostic map, not a universal benchmark. The correct decision depends on your offer, market, buying journey, data quality and starting point.
Free 48-hour written audit
What you receive.
For accounts spending $3K+/month, I review the available media, conversion and commercial context and return the three highest-impact opportunities. No commitment. No retainer pitch.
Request the diagnostic →- CPL component bridge by channel and period
- Brand, prospecting and retargeting split
- Search-term, placement and PMax waste review
- Conversion-action and landing-path audit
- Three prioritised recovery actions with decision thresholds
Best fit
This diagnosis works when evidence can change a decision.
Strong fit
- B2B, software, education and service teams
- Accounts spending $3K+/month
- A stable conversion action and recent comparison period
- Teams able to inspect lead or CRM quality
Not designed for
- A request to guarantee a specific CPL
- Businesses without a defined conversion action
- Teams optimising lead price without sales evidence
- A one-day performance fluctuation without enough data
Practical questions
Questions that change the diagnosis.
What is a good B2B cost per lead?
A workable CPL is one your qualified rate, close rate, customer value and margin can support. Industry averages can provide context, but they cannot replace your break-even economics or lead-quality evidence.
Should we lower bids when CPL rises?
Only after identifying the component causing the increase. Lower bids may reduce auction cost, but they can also lose high-intent demand or change traffic quality without repairing message or landing-page conversion.
Can a higher CPL be a positive result?
Yes. If the higher-cost cohort produces stronger sales acceptance, more opportunities or a lower customer acquisition cost, the commercial result improved even though the platform lead metric worsened.
How much data is needed for a CPL audit?
Use enough data to compare equivalent periods and conversion definitions. The audit can start with limited volume, but conclusions should be labelled by confidence and should not overstate short-term movement.