E-commerce profitability solution
The dashboard shows sales. The business does not keep enough profit.
Reconcile platform-reported revenue with product cost, shipping, discounts, fees, returns and customer mix before calling paid media profitable.
Best suited to e-commerce brands spending $3K+/month · Direct with Thomas · No retainer pitchWhen e-commerce sales grow but profit does not, replace headline ROAS with contribution after product cost, fulfilment, shipping subsidy, discounts, payment fees, cancellations, returns and media. Reconcile the same orders across ad platforms, analytics and the commerce system, then decide which products, customers and campaigns deserve more spend.
Client evidence · Google Ads e-commerce
Strong platform ROAS still needs a profit reconciliation.
This anonymised client account from my work portfolio records £6,623.65 in Google Ads cost and £139,792.96 in conversion value from May to July 2026—a platform-reported ROAS of 21.11. The commercial decision still depends on order and margin data outside this screenshot.
Inspect the source context →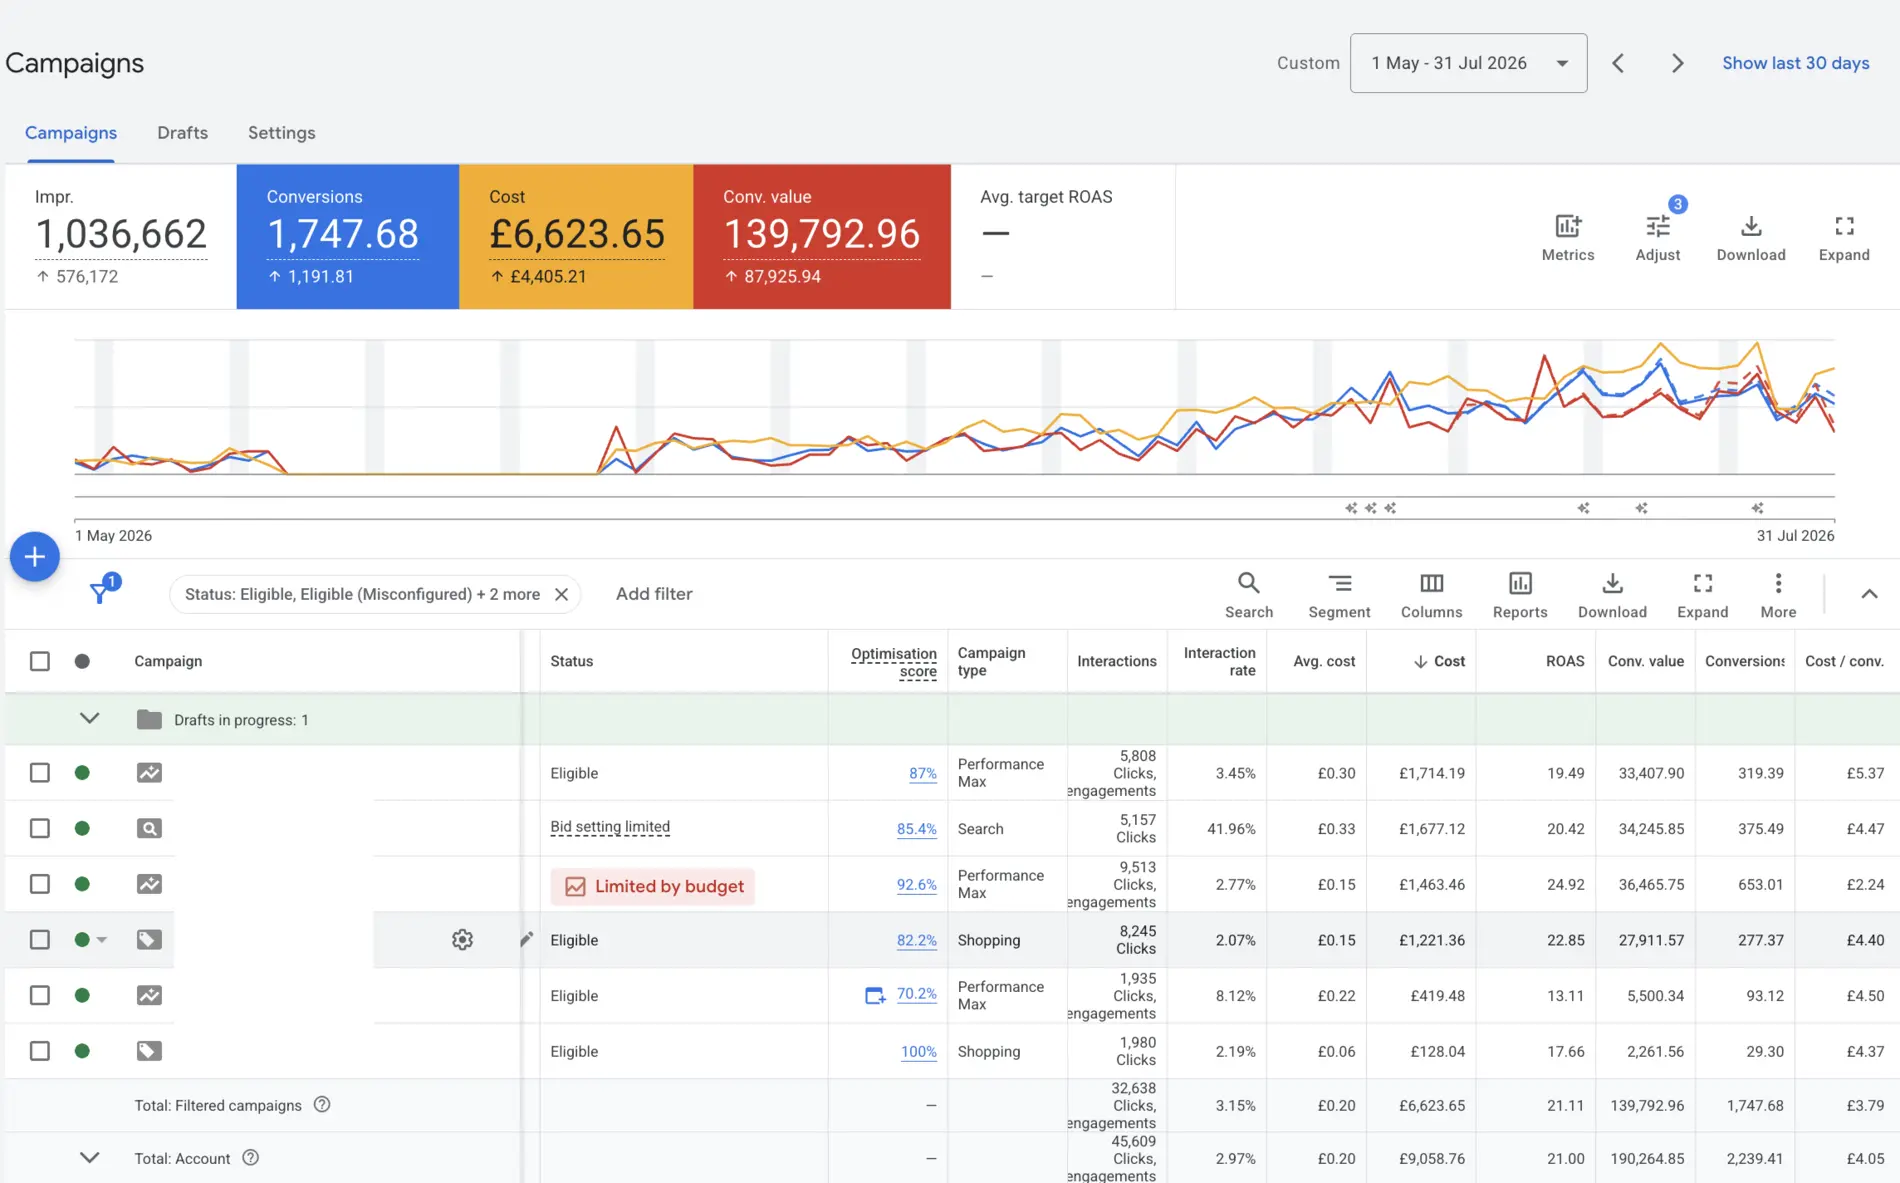
What this looks like
Recognise the symptom before choosing the fix.
ROAS improves; cash remains tight
Platform revenue may include tax, shipping, returning customers or attributed orders that do not create enough contribution after fulfilment and media.
Revenue grows faster than profit
Discounting, low-margin product mix, rising acquisition cost or higher return rates can make each additional sale less valuable.
Every system reports a different answer
Meta, Google, analytics and the store use different attribution rules, dates and revenue definitions, so teams defend dashboards instead of making one commercial decision.
What may be underneath
The ad account may be reporting the symptom—not the cause.
Platform conversion value is treated as collected revenue
Attributed value can differ from paid, fulfilled and retained order value because attribution, cancellations, refunds and consent are handled differently.
Gross revenue hides the cost of the order
COGS, pick-and-pack, shipping subsidy, payment fees, discounts and returns reduce the amount available to pay for acquisition.
Returning demand is credited as new acquisition
Brand search and remarketing can receive credit for customers who already knew the store, making prospecting economics look stronger than they are.
Budget follows the highest ROAS instead of the best contribution
High-margin products, new customers and incremental demand may deserve spend even when their platform ROAS is lower than retargeting or discounted products.
How I diagnose it
Trace one commercial chain before changing everything.
- 01
Define the contribution unit
Agree which order value and variable costs belong in the commercial decision. Keep tax and pass-through revenue separate where appropriate.
Evidence: A documented contribution formula and allowable acquisition cost. - 02
Reconcile one closed order cohort
Compare platform-attributed value, analytics revenue, store orders, fulfilment, cancellations and refunds for the same order dates.
Evidence: A source reconciliation with timing and attribution differences labelled. - 03
Separate product and customer economics
Break out product margin, discount level, new versus returning customer and acquisition role instead of using one blended ROAS.
Evidence: Contribution after media by product, customer type and channel role. - 04
Reallocate against commercial thresholds
Set hold, repair, scale and stop rules using contribution and cash timing while retaining platform metrics as diagnostics.
Evidence: Decision thresholds with owner, review cadence and exceptions.
Decision map
Match the observed pattern to the first useful action.
| Observed pattern | What it may mean | First decision |
|---|---|---|
| High ROAS; low contribution | Revenue or cost definition gap | Reconcile orders and margin before changing campaigns |
| Profit falls as discounting rises | Offer-dependent demand | Test value and product mix rather than buying more discounted sales |
| Returning customers dominate attributed revenue | Incrementality risk | Separate acquisition from retention and brand capture |
| One product drives revenue but not margin | Product-mix problem | Use product-level contribution in feed and budget decisions |
| Contribution remains healthy after reconciliation | Economics support growth | Move to controlled scaling with explicit guardrails |
This is a diagnostic map, not a universal benchmark. The correct decision depends on your offer, market, buying journey, data quality and starting point.
Free 48-hour written audit
What you receive.
For accounts spending $3K+/month, I review the available media, conversion and commercial context and return the three highest-impact opportunities. No commitment. No retainer pitch.
Request the diagnostic →- Platform-to-store revenue reconciliation
- Contribution and allowable acquisition-cost model
- New versus returning customer split
- Product and channel profitability map
- Three budget decisions with commercial thresholds
Best fit
This diagnosis works when evidence can change a decision.
Strong fit
- E-commerce brands with recorded orders and variable costs
- Accounts spending $3K+/month
- Teams able to export store and advertising data
- Leadership willing to use contribution instead of ROAS alone
Not designed for
- Stores without reliable order or cost data
- Teams seeking a universal ROAS benchmark
- A request to guarantee profit
- Businesses unwilling to share commercial inputs
Practical questions
Questions that change the diagnosis.
Why do I have good ROAS but no profit?
Platform ROAS normally divides attributed conversion value by media spend. It does not automatically subtract product cost, fulfilment, shipping subsidy, payment fees, discounts, returns, agency cost or overhead. It may also credit returning demand differently from your store or analytics.
Which metric should replace ROAS?
Keep ROAS as a platform diagnostic, but make the commercial decision with contribution after variable costs and media. For acquisition, separate new-customer contribution and payback from returning-customer revenue where the data allows.
Why do Meta, Google Analytics and Shopify report different revenue?
They use different attribution models, time zones, consent coverage, event rules and order dates. The goal is not to force identical numbers; it is to document the differences and use the commerce system as the order and refund record.
Can high-ROAS campaigns still be a bad investment?
Yes. They may rely on brand demand, returning customers, discounts or low-margin products. A lower-ROAS campaign can create more new-customer contribution or incremental demand, so both need a commercial comparison.