
The platform did not need more activity. The business needed a clearer decision.
When ecommerce acquisition costs rise, the first reaction is often to change several things at once: launch more creative, narrow audiences, reduce budgets, rebuild campaigns or add a promotion. That activity can feel decisive while destroying the evidence needed to learn what actually changed.
My verdict from this case is narrower: protect the purchase signal, reduce weak combinations and earn the right to reallocate budget. The management job is not to chase yesterday's number. It is to preserve enough comparable evidence to decide whether the constraint sits in media delivery, creative response, the store journey or the underlying commercial offer.
This article is distinct from the diagnostic page for rising ecommerce cost per purchase. That page helps owners separate possible causes. Here, I document one anonymised recovery, explain the limits of the proof and show the weekly management process I would carry forward.
Current search results for ecommerce advertising cases often foreground a large revenue or return-on-ad-spend number. The owner-level gap is what happens between a bad week and a responsible recovery decision. A credible case should show the starting condition, the action sequence, the observed outcome and what the evidence cannot establish.
The DTC case: purchases recovered as cost fell
The approved source is an anonymised Meta Ads trend from an international DTC ecommerce account between 1 June and 27 September 2024. At the July low, weekly purchases had fallen below 20 while cost per purchase climbed above $60. The account needed recovery before scale.
My recorded contribution was to reset the creative-testing cadence, prioritise purchase signals, cut weak combinations and reallocate spend only after conversion volume recovered. By late September, the chart shows roughly 80 weekly purchases and an approximate cost per purchase of $15–$20.
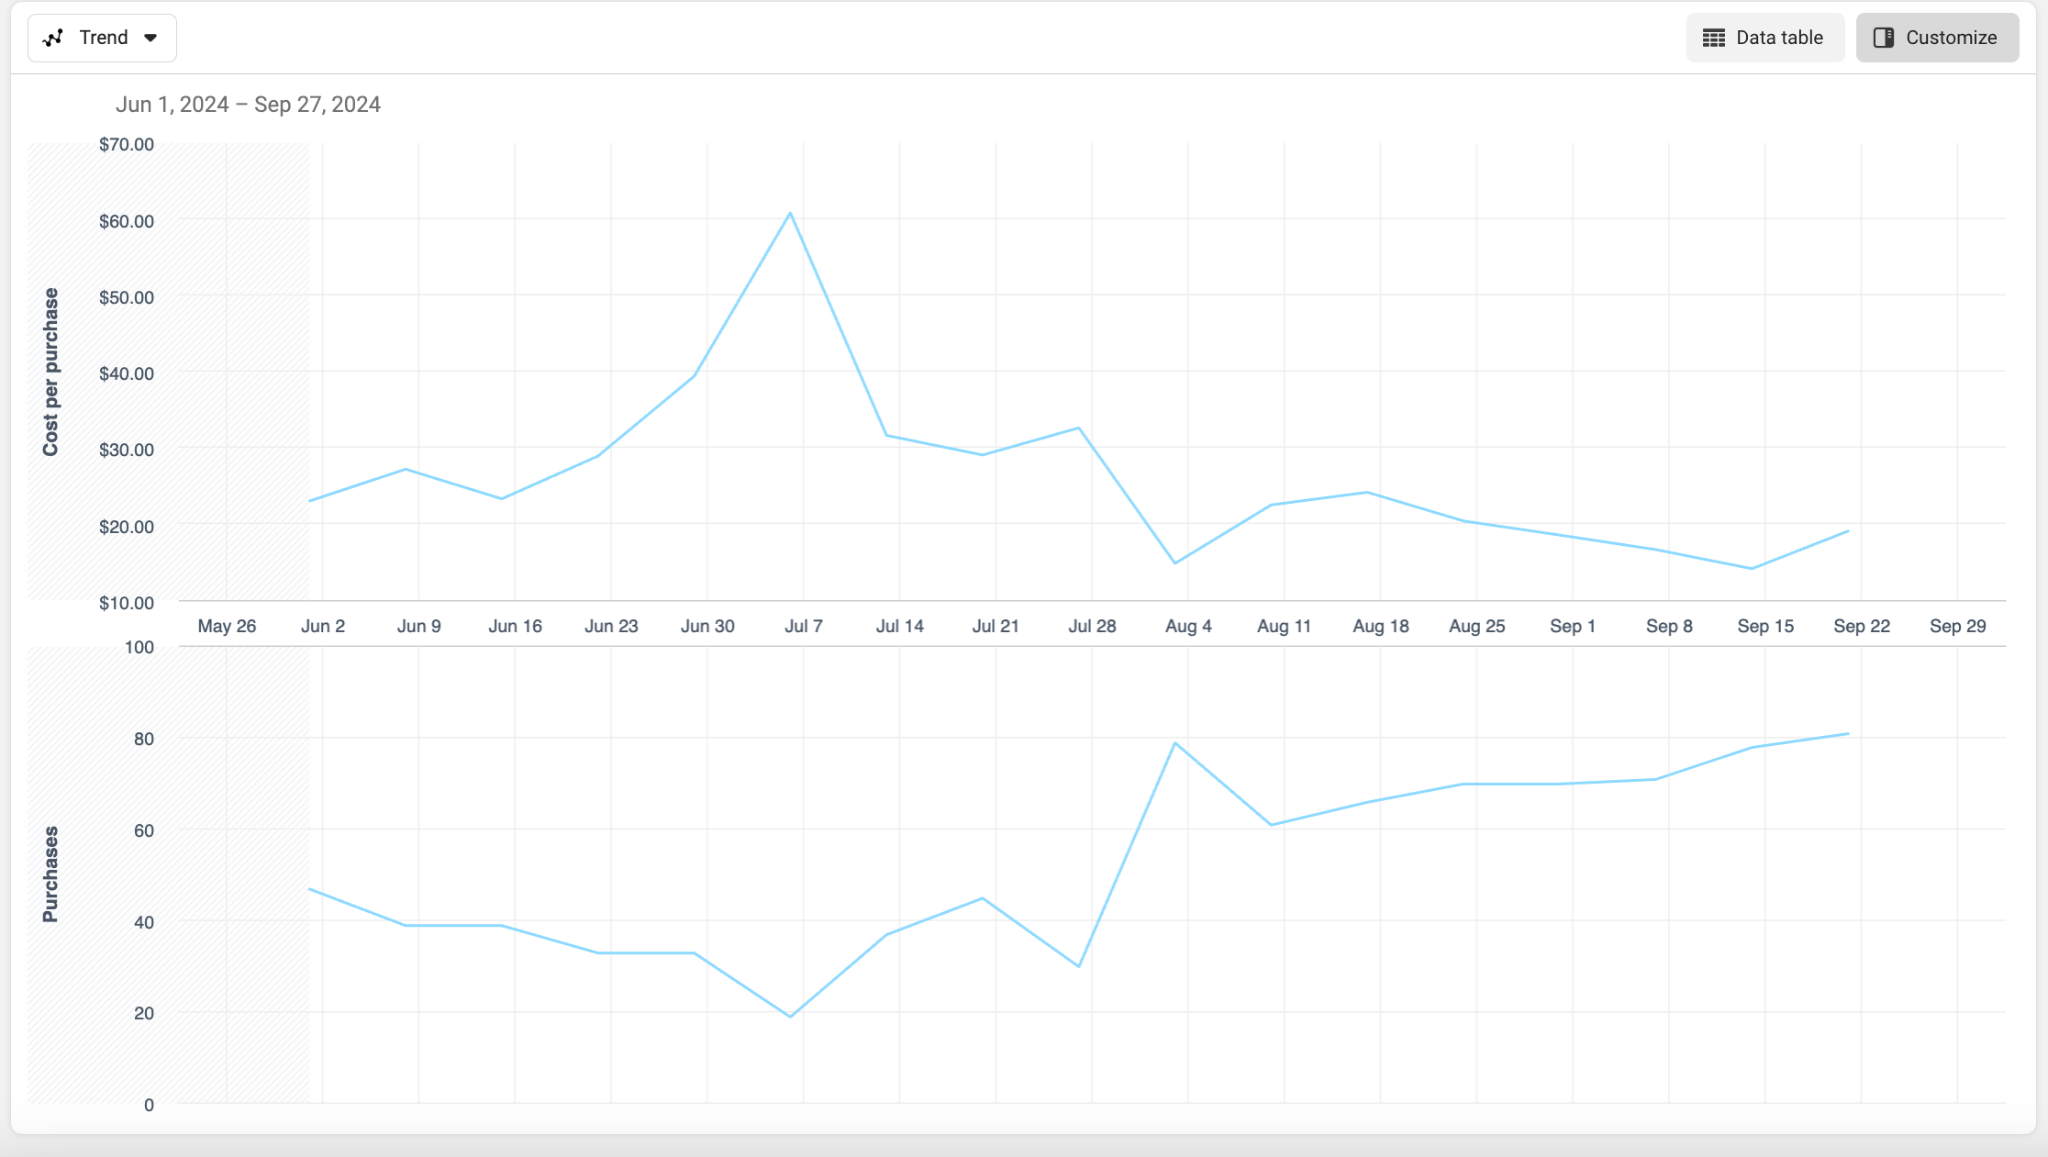
Values are rounded from the source chart. The record shows a platform-reported purchase recovery; it does not disclose profit, refunds, product mix, incrementality or a controlled counterfactual.
The limitation matters. A lower platform cost per purchase is not the same as stronger contribution after advertising. The screenshot does not show revenue reconciliation, gross margin, discounts, fulfilment, returns, new-customer mix or repeat value. It also cannot isolate the effect of any one change or prove that I alone caused the outcome.
The defensible conclusion is therefore specific: purchase volume and reported acquisition efficiency recovered during the period in which I changed the creative and budget decision process. It is evidence that the operating approach coincided with recovery—not a universal formula or guaranteed result.
Four lessons I would take into the next ecommerce account
1. A cost spike is a symptom, not a diagnosis
Cost per purchase combines the cost of reaching people, their response to the creative and the share of paid sessions that buy. Product, market, device and customer mix can move the blended number too. Separate those components before blaming an algorithm or rebuilding the account.
2. Creative testing needs a business question
More variations are not automatically more learning. Each test should state the buying obstacle it addresses, the product or audience context and the decision it could change. In this case, the useful shift was a repeatable cadence with weak combinations removed—not an endless queue of unrelated assets.
3. Purchase volume affects what the system can learn
Meta explains that its delivery system learns from the optimisation event selected for an ad set and that significant edits can return delivery to a learning stage. That does not create a universal volume rule for every store. It does explain why constant restructuring during a low-volume period can make diagnosis harder. I prefer fewer, more interpretable decisions.
4. Recovery is not permission to scale blindly
Before adding budget, reconcile platform purchases with store records and check the economics the platform cannot see. Google Analytics' ecommerce reports depend on correctly sent events, while its purchase-journey reports show where users drop between stages. Shopify also points owners to inventory analytics, sell-through and returns. Those signals stop a media recovery from creating a stock, cash or fulfilment problem.
The Weekly Purchase Recovery Loop
I use this six-stage loop to turn a volatile account into a manageable decision system. It is designed for an owner and operator to review together; it is not a list of settings for the owner to configure personally.
Confirm the outcome
Match platform purchases to the store for the same period, timezone, attribution view and order status.
Remove misleading blends
Split products, markets, prospecting, remarketing, new customers and major offer changes where evidence allows.
Find the broken component
Compare reach cost, creative response, paid-session progression and purchase completion before choosing a fix.
Protect the commercial constraint
Choose the highest-confidence recovery that respects margin, cash, stock and fulfilment capacity.
Change one material layer
Keep enough of the account stable to understand whether the selected creative, traffic or journey change worked.
Wait for usable evidence
Account for reporting lag and the buying cycle, then scale, hold, revise or stop with the limitation recorded.
Google Ads documents that conversions can be reported after the original interaction and that incomplete recent data can distort comparison. The principle applies beyond one platform: a weekly review should distinguish a real deterioration from immature data. “Wait” is a valid decision when the evidence window has not matured.
The loop also keeps responsibility visible. Advertising can recover efficient purchase delivery, but pricing, stock, returns and fulfilment are business inputs. If revenue rises while contribution falls, use the ecommerce profit bridge. If thin margins cannot support the recovered cost, use the Paid Growth Margin Gate before scaling.
Choose the next move from the evidence
| Weekly evidence | Likely interpretation | Owner-level decision | Avoid |
|---|---|---|---|
| Platform purchases fall; store orders hold | Measurement or attribution mismatch | Repair reconciliation before cutting demand | Treating one platform as the sales ledger |
| Reach costs rise; response and store conversion hold | Auction or market pressure | Protect profitable demand; test boundaries deliberately | Rebuilding the whole journey |
| Creative response falls; paid-session conversion holds | Fatigue or weaker relevance | Refresh the buying angle and product demonstration | Discounting before testing the message |
| Clicks hold; checkout progression falls | Offer, product, delivery or store friction | Fix the first broken journey stage | Changing bids to solve a checkout problem |
| Purchases recover; contribution remains weak | Media recovery without profit recovery | Hold scale and repair economics or product mix | Celebrating platform efficiency as profit |
| Purchases and verified contribution recover | Recovery supported by commercial evidence | Increase budget in a controlled step and keep the stop rule | Assuming the next increment behaves the same |
The matrix turns the weekly meeting into a decision rather than a recital of metrics. It also creates a record of what leadership knew at the time. That is useful when a result later changes: the team can distinguish a bad decision from a reasonable decision made with limited evidence.
An illustrative next-week decision board
Illustrative example — not client proof
| Observed this week | Interpretation | Next action | Review rule |
|---|---|---|---|
| Store orders reconcile within the business's tolerance; one product group carries most of the cost increase | Not a site-wide measurement failure | Hold the stable group; replace one weak creative angle for the affected product group | Review after the agreed purchase window matures |
| Checkout progression holds; new-customer purchase cost worsens | Acquisition problem more likely than checkout failure | Protect the new-customer budget cap and test the next buying angle | Stop if contribution breaches the owner-set floor |
| Purchase volume improves, but stock cover tightens | Demand recovery creates an operating constraint | Do not scale the constrained SKU; redirect only where margin and stock support it | Recheck inventory, inbound stock and cancellations |
The example contains no universal cost target, sample threshold or promised recovery period. Those rules belong to the store's own economics and buying cycle. The important pattern is that every row names an observation, an interpretation, one action and the evidence required to review it.
This is what I expect good paid ads management to produce: a clear weekly decision loop, documented ownership and the discipline to leave unrelated variables unchanged. Creative testing, conversion tracking and budget management should be connected to the same commercial question.
For context, review the original anonymised DTC case, ThomPerformance's evidence standards, Meta Ads support, conversion tracking, broader growth services and Thomas's operator-led model.
Sources and evidence notes
Sources and current search results were checked on 17 September 2026. Search prioritisation is qualitative; no unverified keyword volume, universal acquisition benchmark or guaranteed recovery timeline is claimed. Case values are rounded from an approved anonymised platform record. The Weekly Purchase Recovery Loop, decision matrix and illustrative next-week board are original ThomPerformance practitioner analysis.
- ThomPerformance: anonymised DTC ecommerce purchase-recovery case
- Meta Business Help Centre: significant edits and the learning phase
- Meta Business Help Centre: ad-delivery best practices
- Google Analytics: Purchase journey report
- Google Analytics: Ecommerce purchases report
- Google Ads Help: understanding conversion delay
- Shopify Help Center: inventory management
Frequently asked questions
What caused the ecommerce cost per purchase to rise in this case?
The source record shows the symptom and the recovery actions, not a controlled causal decomposition. Cost per purchase rose above $60 while weekly purchases fell below 20. I reset the creative-testing cadence, prioritised purchase signals, cut weak combinations and waited for conversion volume to recover before reallocating more spend. Product, market and offer details remain confidential.
How quickly did ecommerce purchase performance recover?
The approved Meta Ads record covers 1 June to 27 September 2024. By late September, weekly purchases were roughly 80 and cost per purchase was approximately $15–$20. That timeframe describes this account only. It is not a promise or benchmark for another store.
Does a lower cost per purchase prove profitable growth?
No. It shows that the advertising platform recorded purchases more efficiently. Profitability still depends on revenue reconciliation, product margin, discounts, refunds, fulfilment, payment fees, customer mix and repeat value. This case does not disclose those inputs, so it should not be presented as a profit or incrementality study.
Should an ecommerce brand cut advertising when costs spike?
Not automatically. First confirm that purchase tracking and comparison periods are trustworthy, then separate auction cost, creative response, paid-session conversion and product mix. Protect cash while you identify the broken component. Cut, hold or rebuild based on commercial evidence rather than one blended platform number.
What should an ecommerce owner expect from weekly ads management?
A weekly review should reconcile platform and store evidence, show where the purchase-cost equation changed, name the next decision, record what will remain unchanged and set a review date. Activity logs and dashboards are useful inputs, but the management output is a commercially accountable decision.
Recover the decision process before you try to recover scale
This case does not say that one creative refresh will reduce every store's cost per purchase. It shows that a disciplined operating sequence can turn a volatile account into a series of accountable decisions. Reconcile the outcome, isolate the broken component, protect the commercial constraint and add budget only after the evidence supports it.
Which part of your current weekly review is missing: reconciliation, diagnosis, ownership, one clear action or a review rule?