Paid media was the channel. Business growth was the job.
Seven stories across education, e-commerce, fashion, audience intelligence, digital platforms and search—each framed around the business problem, my contribution and measurable outcome.
I do more than manage campaigns. I improve the system around them.
The work spans acquisition, conversion, customer intelligence, measurement and AI-enabled operating workflows. Client names remain anonymised where appropriate.
01
EDUCATION · VIETNAM · GOOGLE, META & TIKTOK
Leading English Education Group
From platform leads to a measurable enrolment engine
01 / Situation
This established, multi-program education group did not need another channel report. It needed one view of the journey from paid click to lead, deal and enrolment.
02 / My contribution
I rebuilt acquisition decisions around a Lead → Deal → Enrolment model, separated channel roles, connected campaign reporting to CRM stages and used downstream quality—not the cheapest form fill—to guide budget.
03 / Outcome
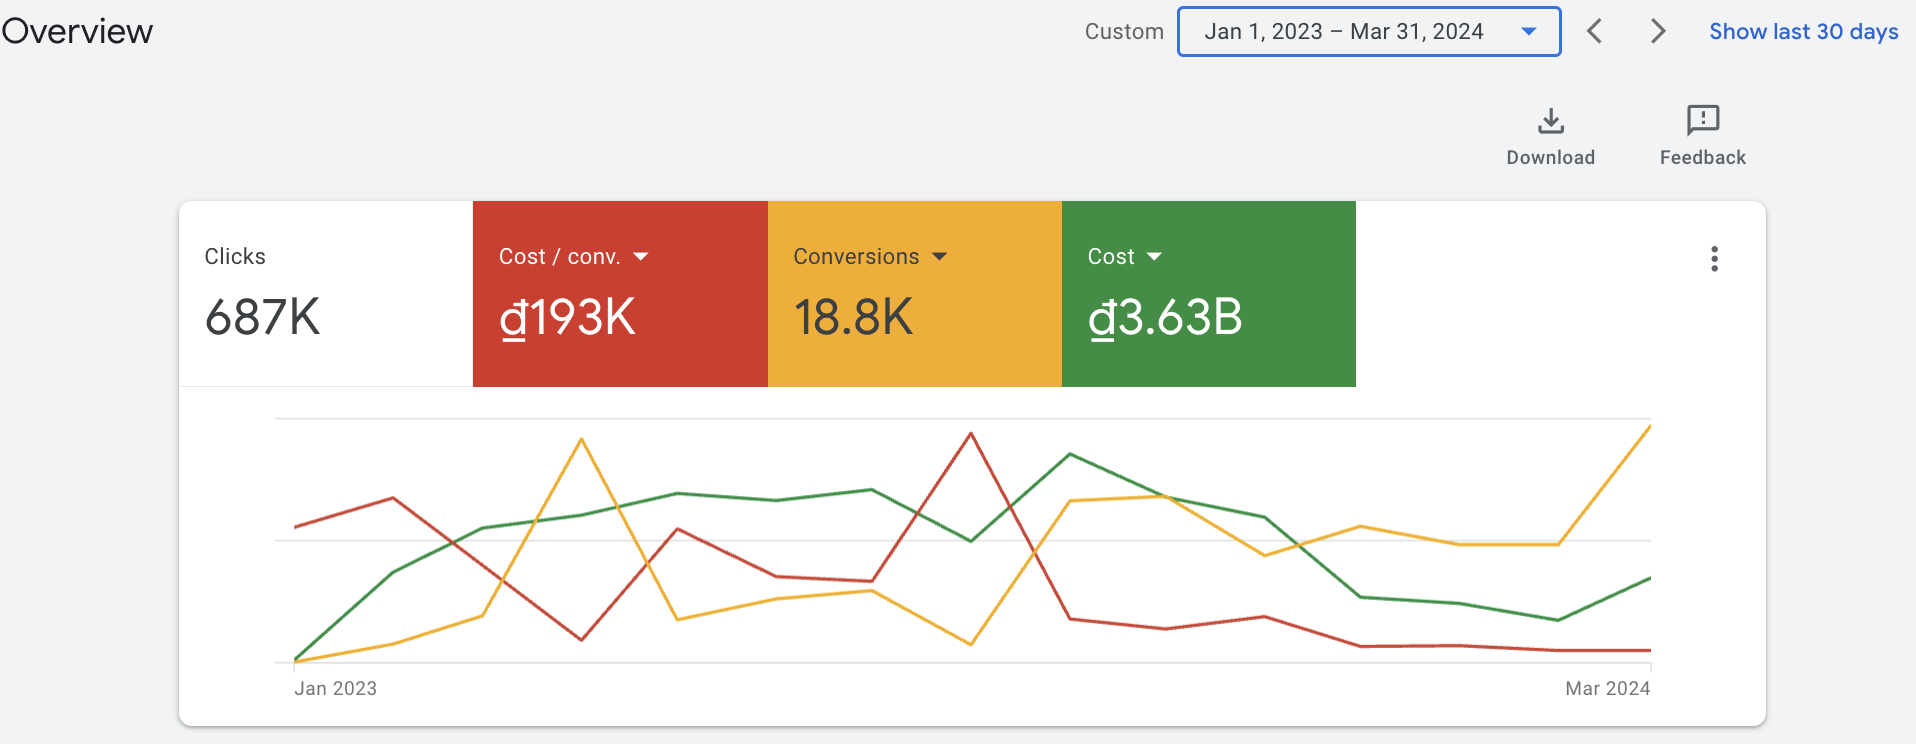
The operating model generated 4,210 leads and delivered 135 enrolments in October. In the same month, lead volume increased 280% year over year.
Performance dashboard
Source evidenceAnonymised client data. Google Ads account overview, Jan 2023–Mar 2024. Dashboard labels shown as captured.
4,210leads generated
+280%October leads YoY
135October enrolments
02
LEAD GENERATION · VIETNAM · META ADS · ANONYMISED
National Education Brand
More monthly leads while bringing cost per lead down
01 / Situation
Lead delivery was volatile. Scaling spend without fixing the instability would have bought more inconsistency.
02 / My contribution
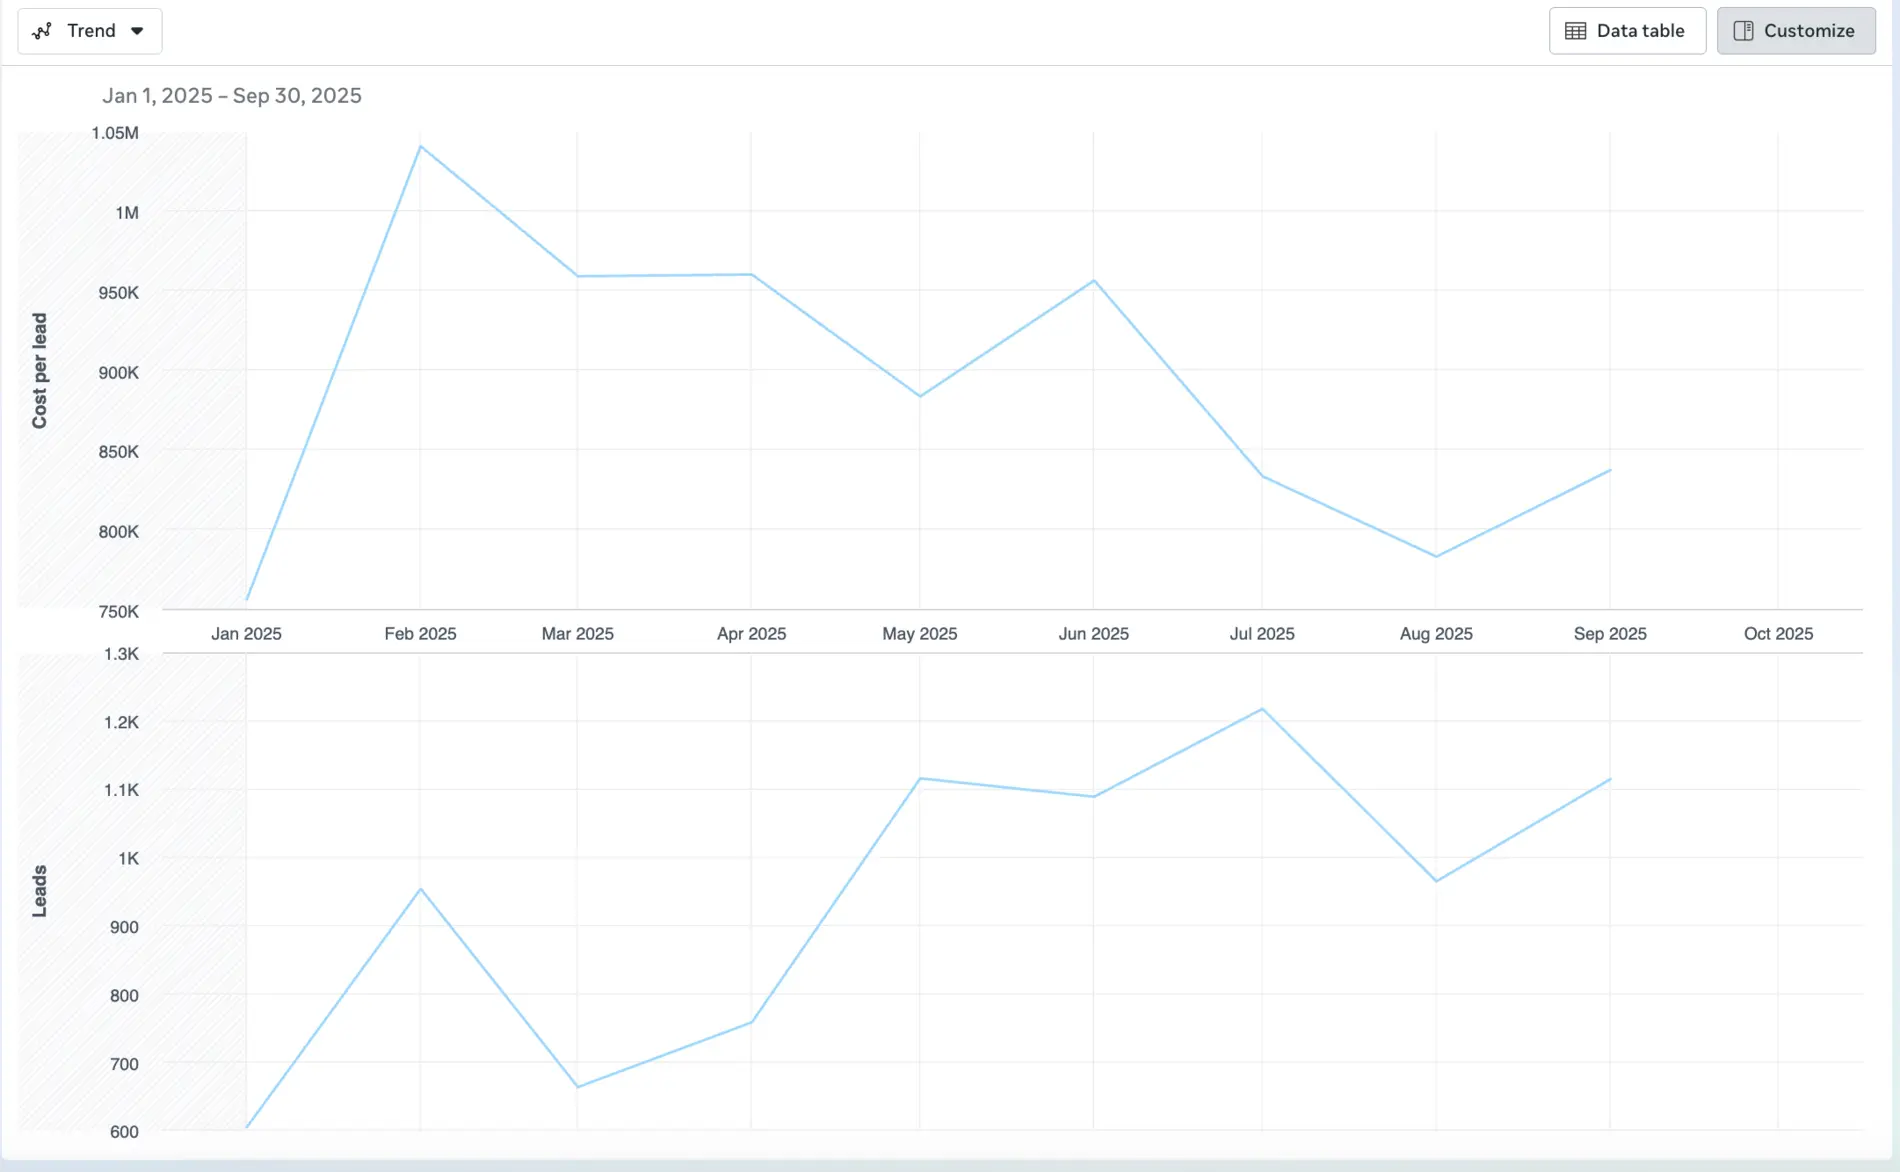
I consolidated the account around clearer conversion signals, refreshed creative by angle and moved budget toward combinations producing both volume and usable lead quality.
03 / Outcome
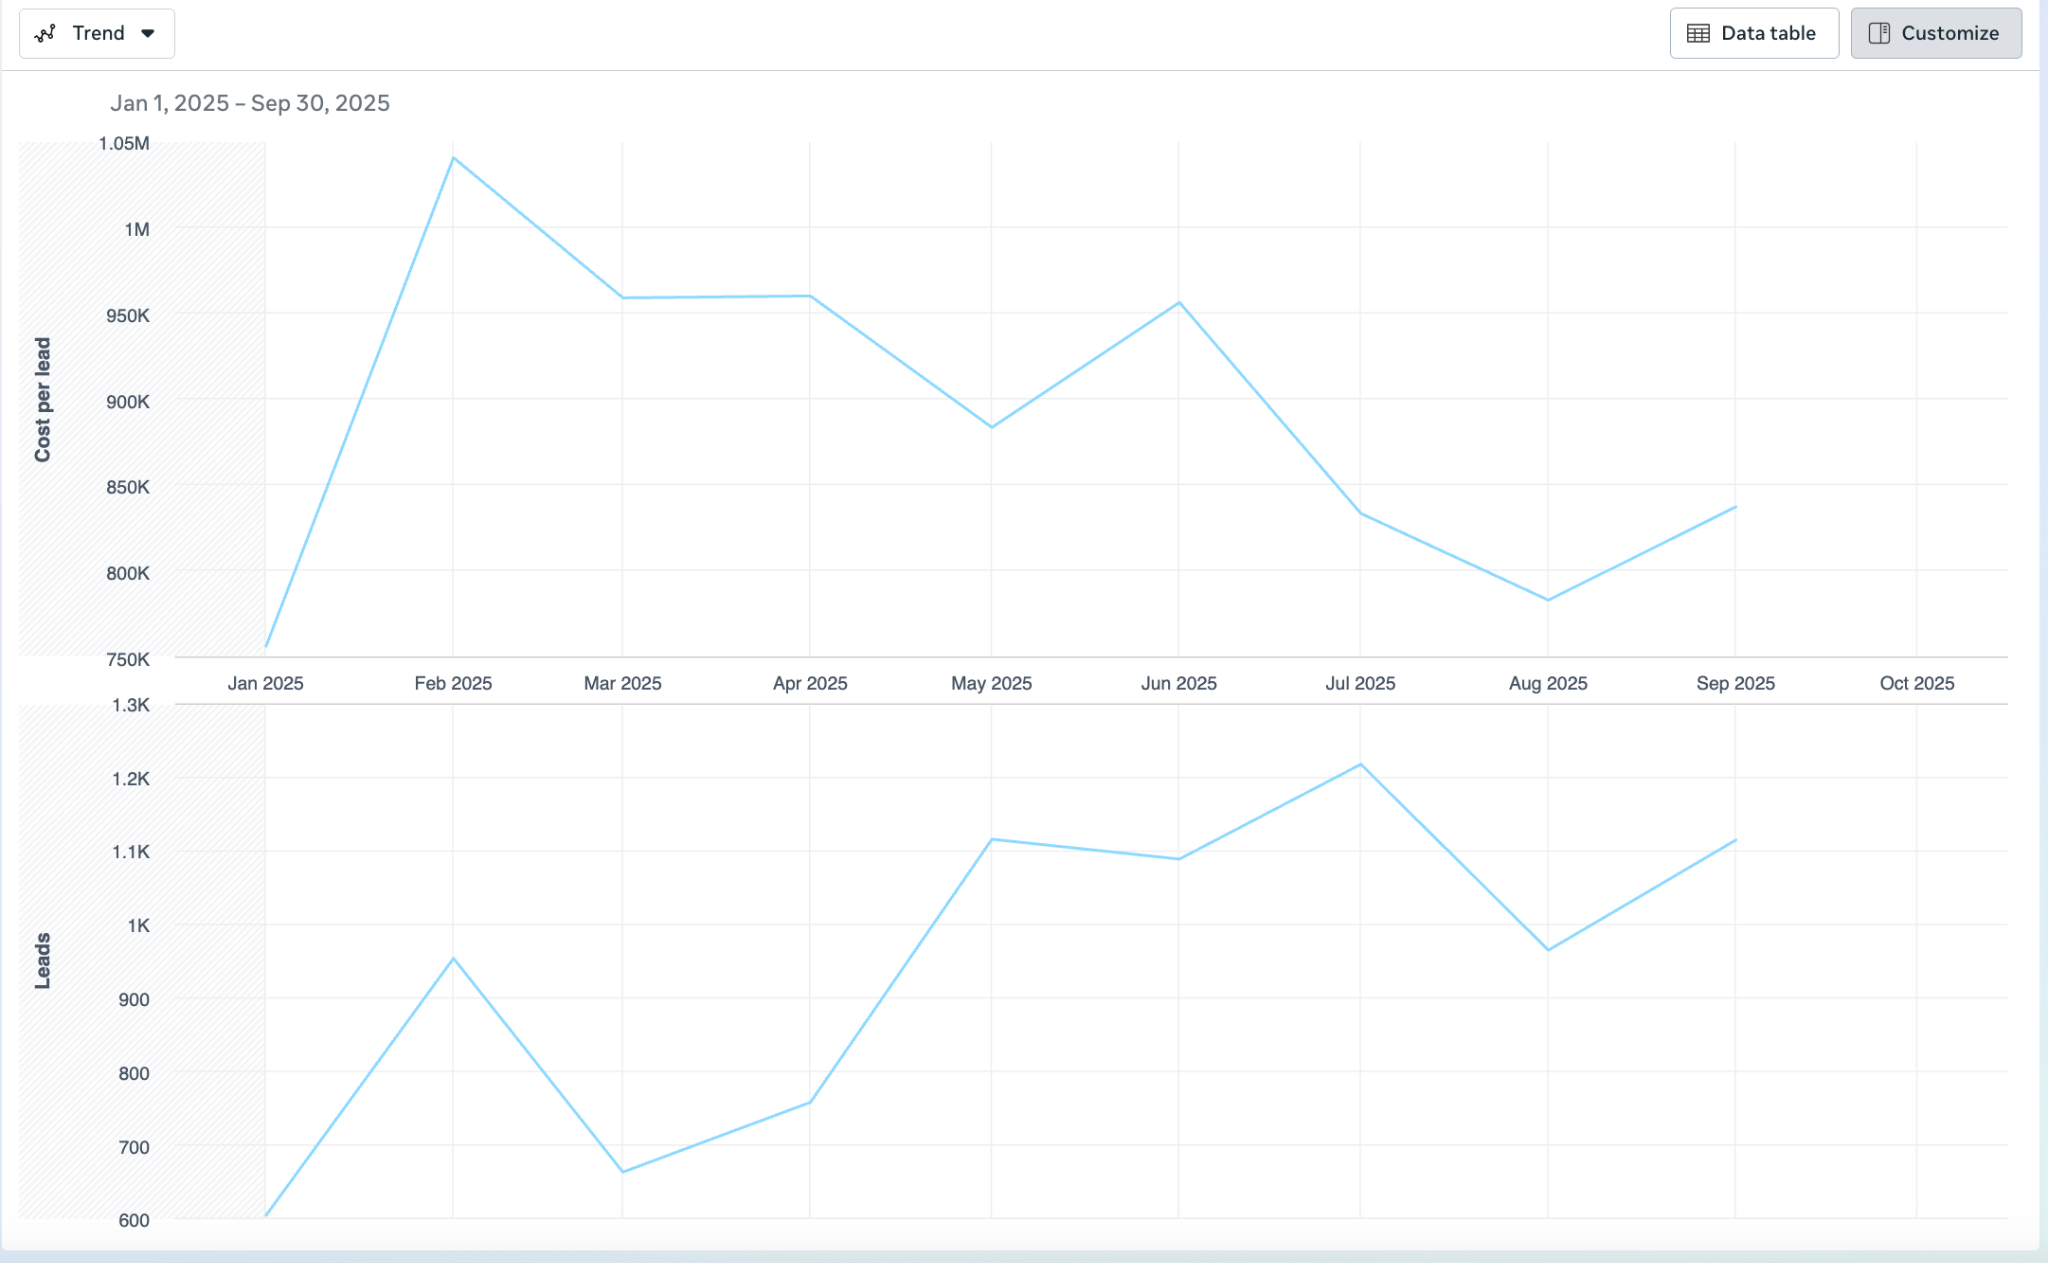
From January to September, monthly lead volume moved from roughly 600 to more than 1,100 while CPL finished materially below the February peak.
Performance dashboard
Source evidenceMeta performance trend, Jan–Sep 2025. Brand withheld; values rounded from the source dashboard.
~600 → 1.1K+monthly lead range
~VND 1.04Mpeak CPL
~VND 0.84MSeptember CPL
03
E-COMMERCE · INTERNATIONAL · META ADS · ANONYMISED
DTC E-commerce Brand
Recovering purchase volume after a cost spike
01 / Situation
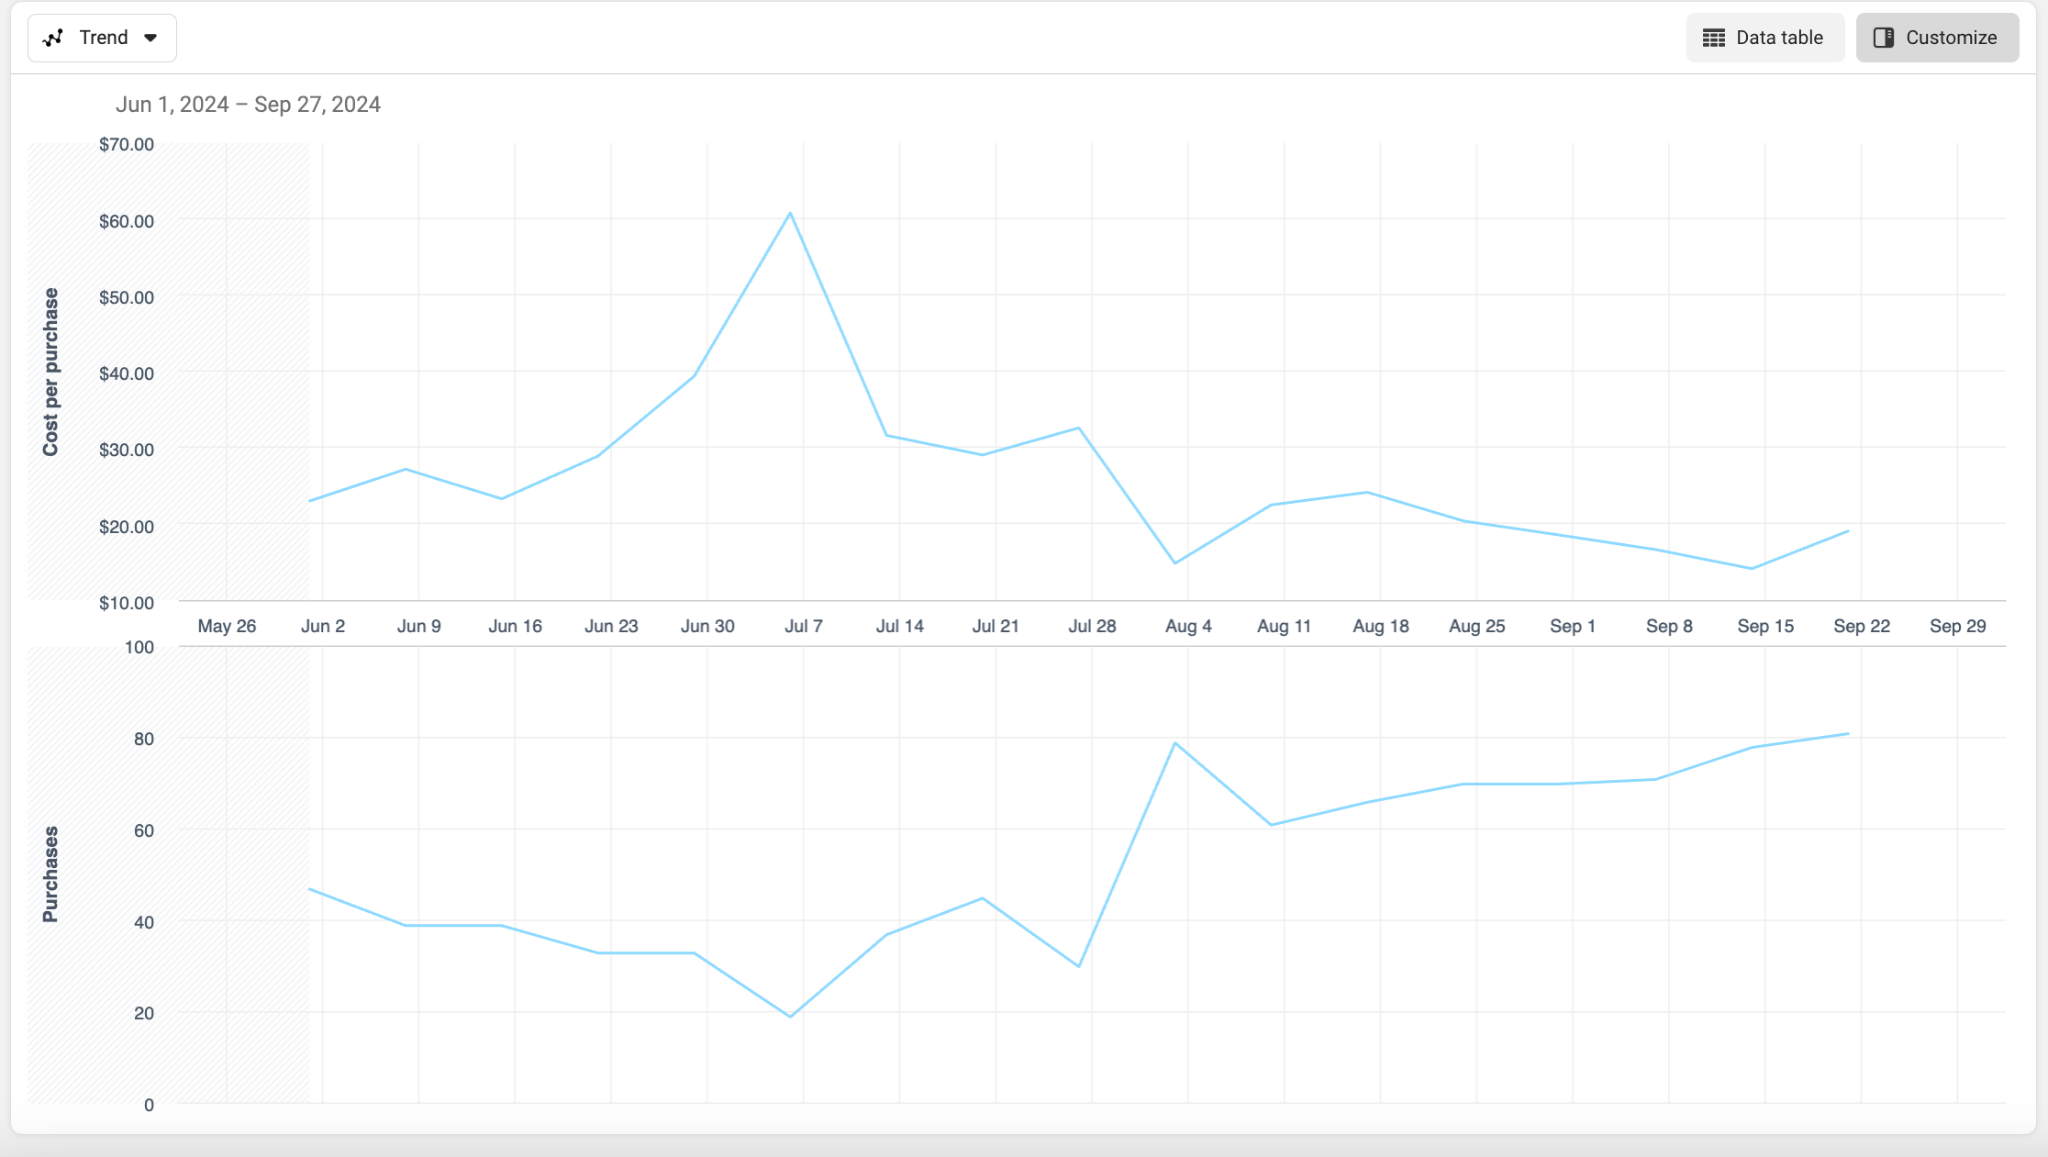
Cost per purchase climbed above $60 as weekly purchases fell below 20. The account needed recovery before scale.
02 / My contribution
I reset the creative testing cadence, prioritised purchase signals, cut weak combinations and reallocated spend only after conversion volume recovered.
03 / Outcome
By September, weekly purchases had climbed to roughly 80 while cost per purchase fell to approximately $15–$20.
Performance dashboard
Source evidenceMeta platform record, Jun–Sep 2024. Values are rounded; brand, attribution window and store reconciliation are not disclosed. This shows an observed recovery, not profit, incrementality or a guaranteed result.
What I would check next week
Turn the trend into one accountable decision.
The recovery is useful only if the next review connects platform evidence to store economics.
Verify the purchase signalReconcile platform purchases and cost with store orders and revenue for the same period before changing budget.
Read creative by buying angleSeparate combinations still producing purchases from those generating attention without commercial response.
Check economics and capacityReview contribution after ads, inventory and fulfilment constraints; a lower platform CPA is not enough to scale.
Make one owned decisionRecord Scale, Hold, Cut or Investigate, with an owner, the evidence limitation and the next review date.
<20 → ~80weekly purchases
$60+July CPA peak
~$15–$20September CPA
Need the next weekly decision?
Turn the account trend into an owned action plan.
I manage ecommerce advertising by connecting creative tests, conversion signals and business economics—not by optimising to one platform number.
Turning paid reach into stronger onsite conversion
01 / Situation
The brand was reaching millions of users, but only a small share returned to buy. Media delivery and onsite behaviour had to be analysed as one customer journey.
02 / My contribution
I combined cross-channel retargeting with website acquisition and engagement tracking, session recording, heatmaps, creative testing and multivariate landing-page tests.
03 / Outcome
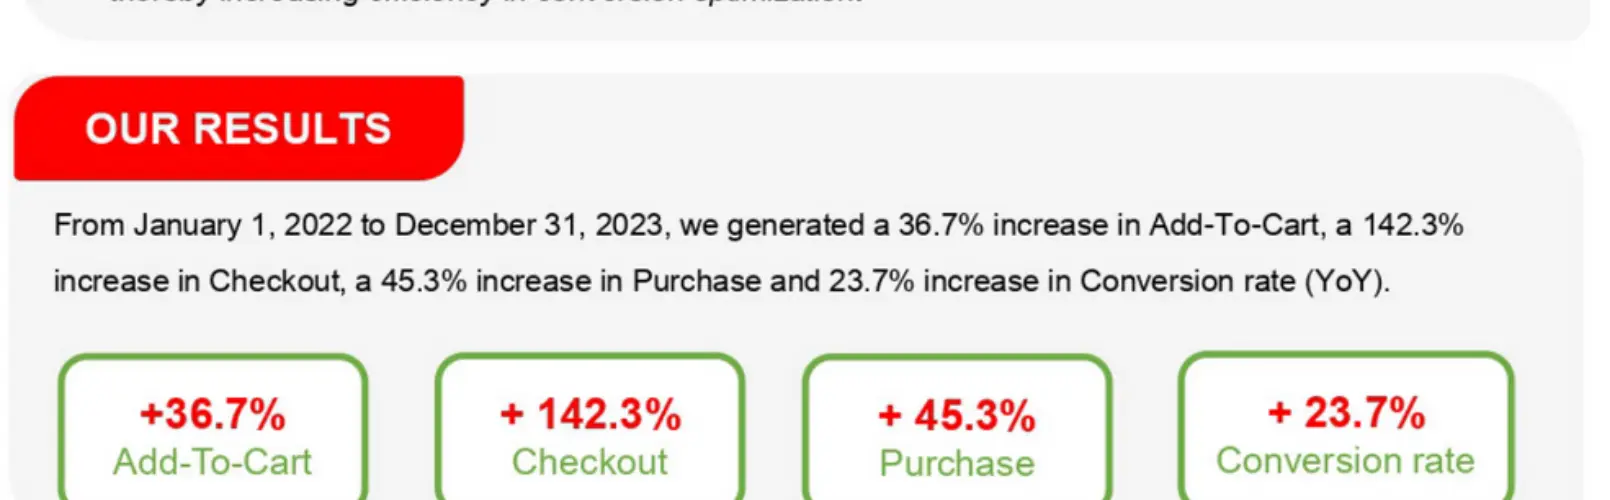
The comparison period recorded growth across the lower funnel: add-to-cart, checkout, purchase and overall conversion rate all increased.
Measured lower-funnel results
Tracking and CRO workflow
Source evidenceSource: Thomas Ho Growth Marketing portfolio. Comparison shown in the original case: Jan 2022–Dec 2023.
Using audience intelligence to improve the buying journey
01 / Situation
A global athletic apparel business needed more actionable audience insight—not another demographic summary—to improve activation and conversion.
02 / My contribution
I structured the work around customer data collection, clustering, buyer-profile development and customer-cycle mapping. The workflow combined analytics and AI-assisted research with human validation and planning.
03 / Outcome
The case documented more than 50 buyer profiles, a developed customer-cycle journey, 137% online revenue growth and a 30% conversion-rate increase.
Audience analysis method
Customer intelligence outcomes
Source evidenceSource: Thomas Ho Growth Marketing portfolio. Client identity withheld; metrics reproduced from the original case slide.
50+buyer profiles
+137%online revenue
+30%conversion rate
06
DIGITAL PLATFORM · GROWTH MARKETING · ANONYMISED
Game & Investor Platform
A full-funnel operating model for user and partner growth
01 / Situation
The platform needed to grow user activity, customer journeys and monetisation—not simply buy more traffic.
02 / My contribution
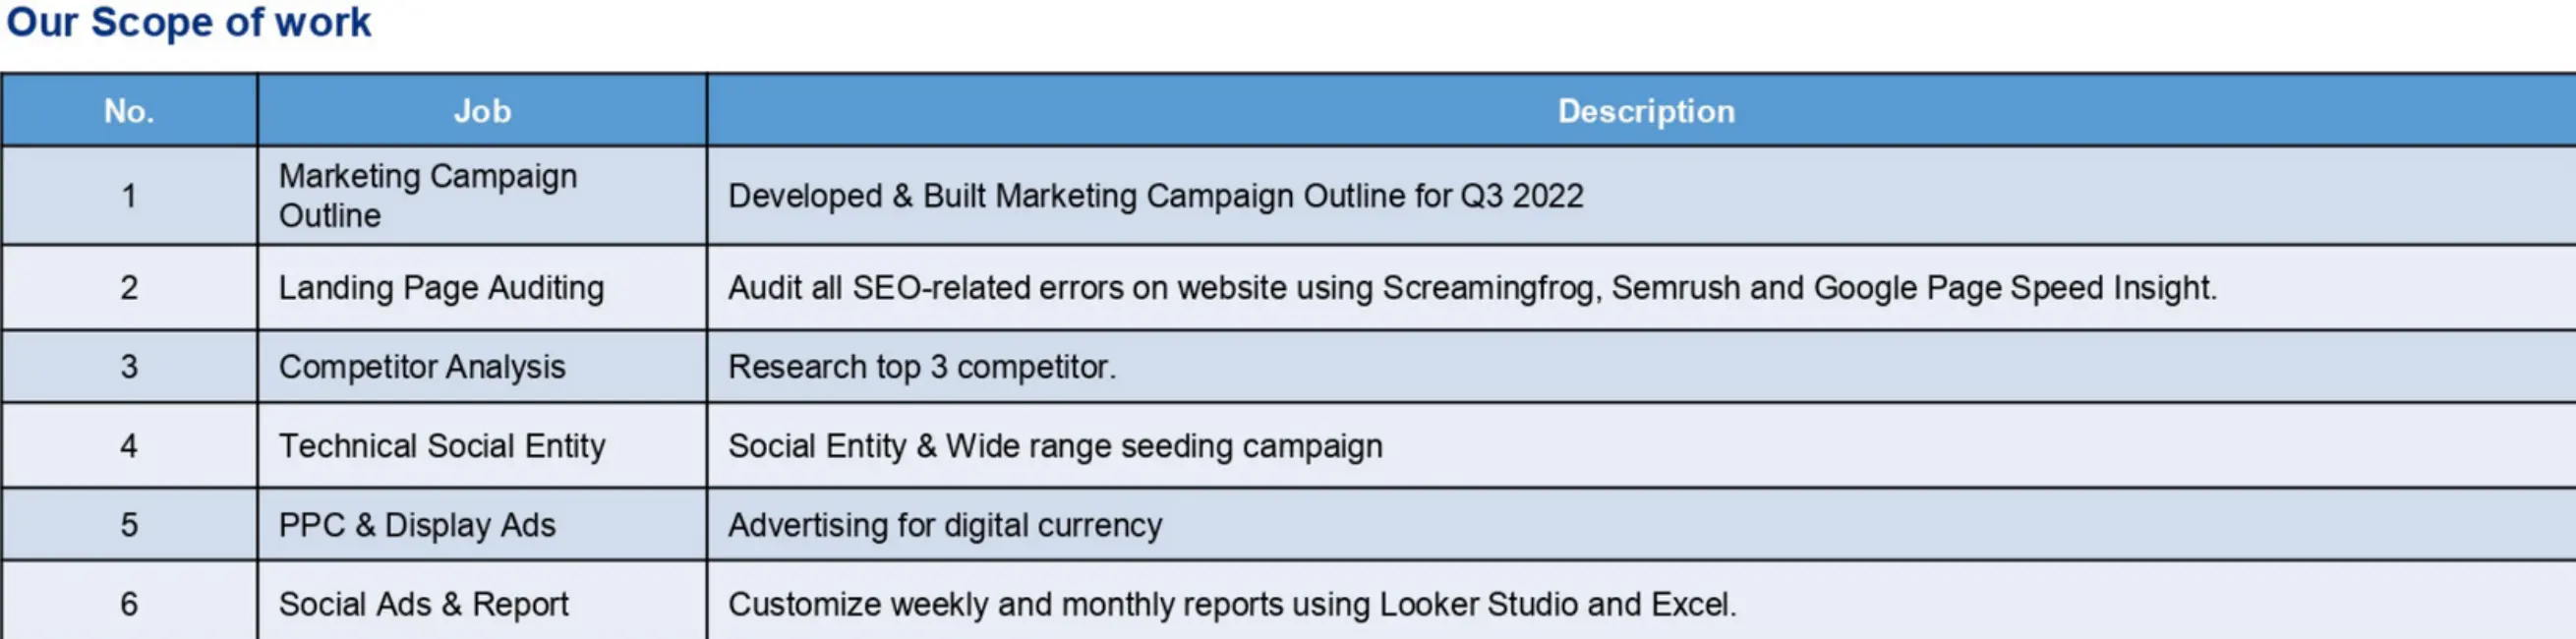
My scope connected campaign planning, landing-page and SEO audits, competitor analysis, technical social-entity work, PPC/display activity, KOL and affiliate programmes, and monthly performance reporting.
03 / Outcome
The portfolio case recorded 200,000 new users, a 137% increase in verified and top-performing affiliate/KOL programmes and a 20% increase in conversion rate.
User and partner growth outcomes
Direct scope of work
Source evidenceSource: Thomas Ho Growth Marketing portfolio, Q3 2022. Client identity withheld.
200Knew users
+137%verified/top affiliates & KOLs
+20%conversion rate
07
SEARCH GROWTH · USA & EU · ANONYMISED
Furniture & Decor Corporation
Building organic demand around paid acquisition
01 / Situation
A large furniture and décor business needed search visibility and site health to support acquisition in the USA and EU.
02 / My contribution
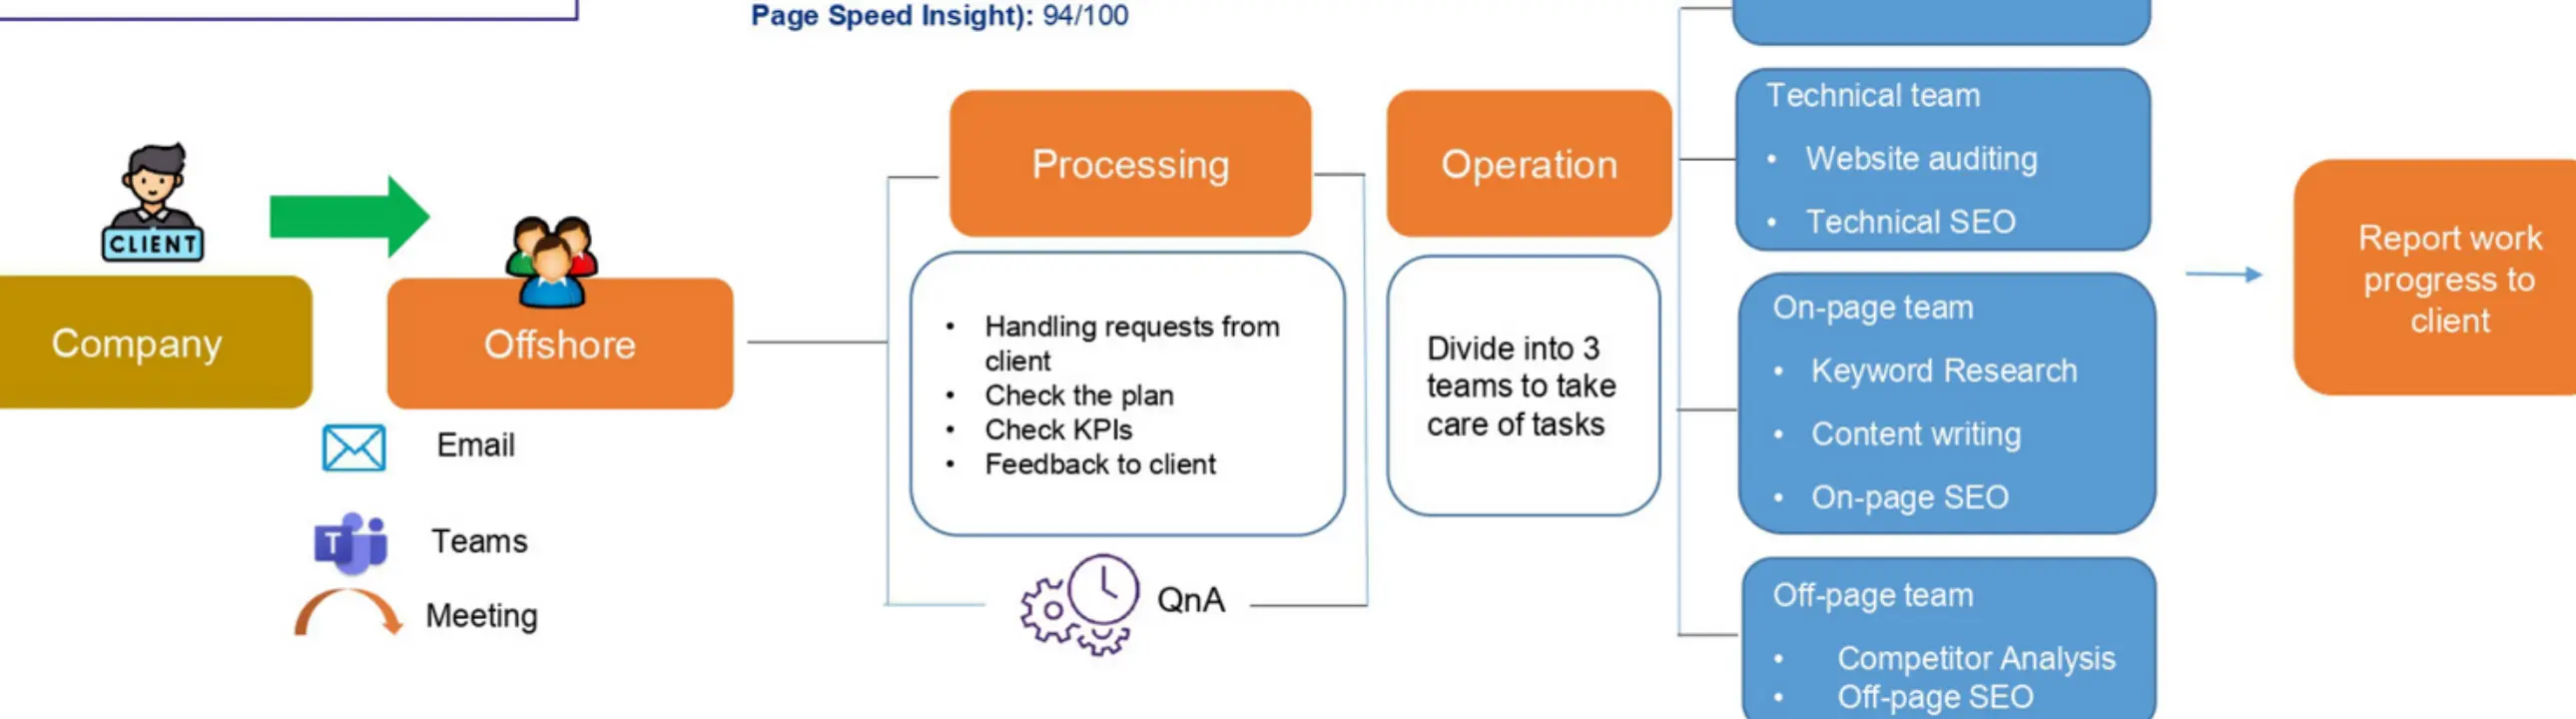
I combined technical SEO, on-page work, keyword research, content planning, off-page SEO and recurring reporting. This broadened the growth system beyond rented paid traffic.
03 / Outcome
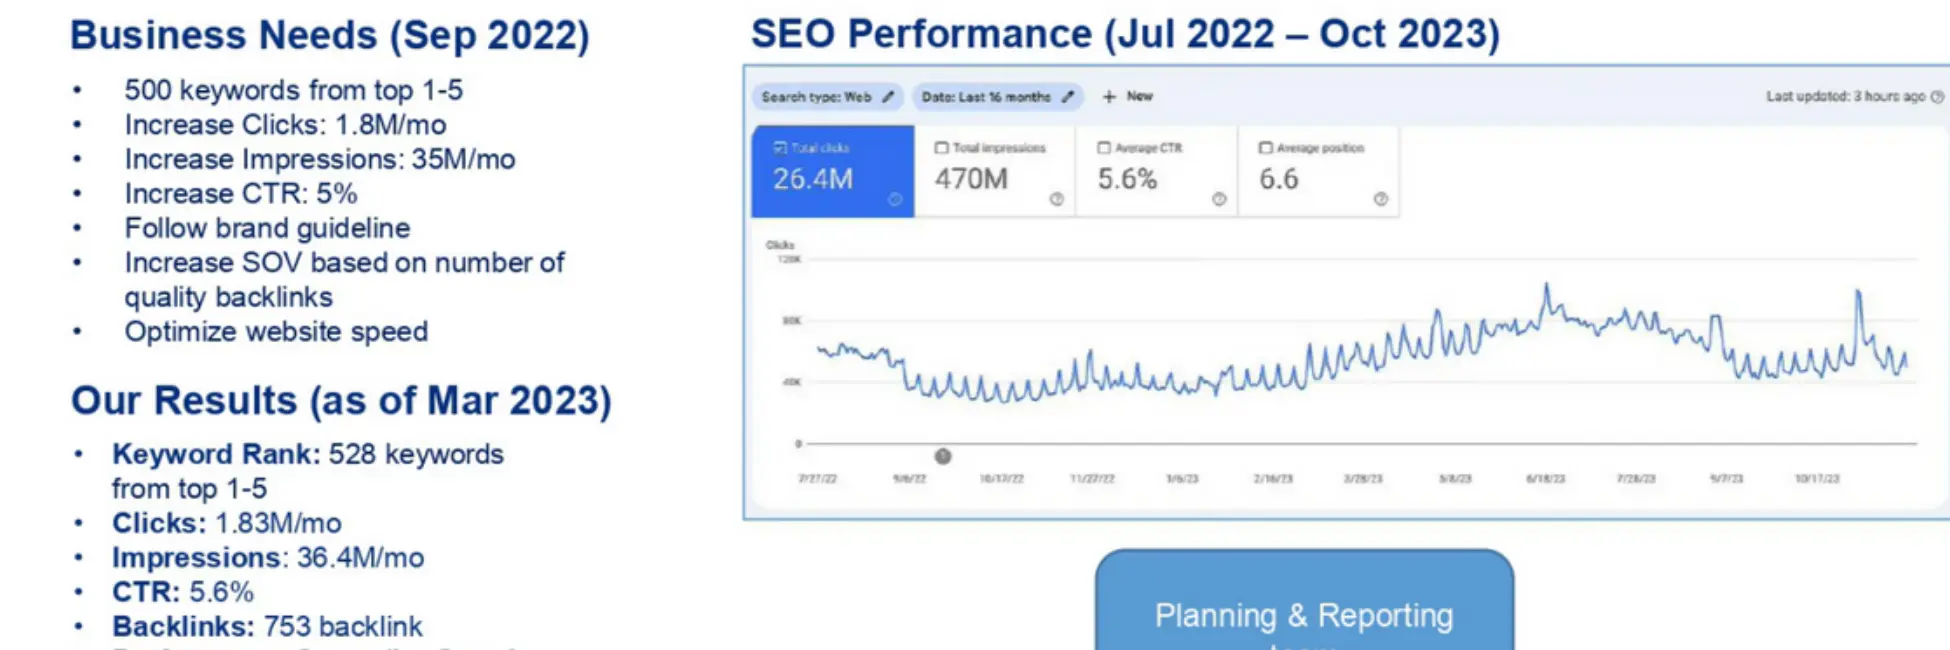
The portfolio recorded 528 keywords in positions 1–5, 1.83M monthly clicks, 36.4M monthly impressions, a 5.6% CTR, 753 backlinks and a PageSpeed score of 94/100.
Search performance evidence
Search growth operating model
Source evidenceSource: Thomas Ho Growth Marketing portfolio, Jul 2022–Oct 2023. Client identity withheld.
528keywords in top 5
1.83Mmonthly clicks
94/100PageSpeed
Portfolio metrics are presented as captured or rounded for readability. Some older cases describe team or employer work; the narrative identifies Thomas’ direct scope and does not claim sole attribution. Past performance does not guarantee future results.
Additional platform records
Source screenshots with the caveats left in.
These anonymised screenshots come from accounts in my work portfolio. They document platform-reported outcomes or trends, but do not by themselves prove sole causation. Client names, campaign names and commercially sensitive rows are withheld.
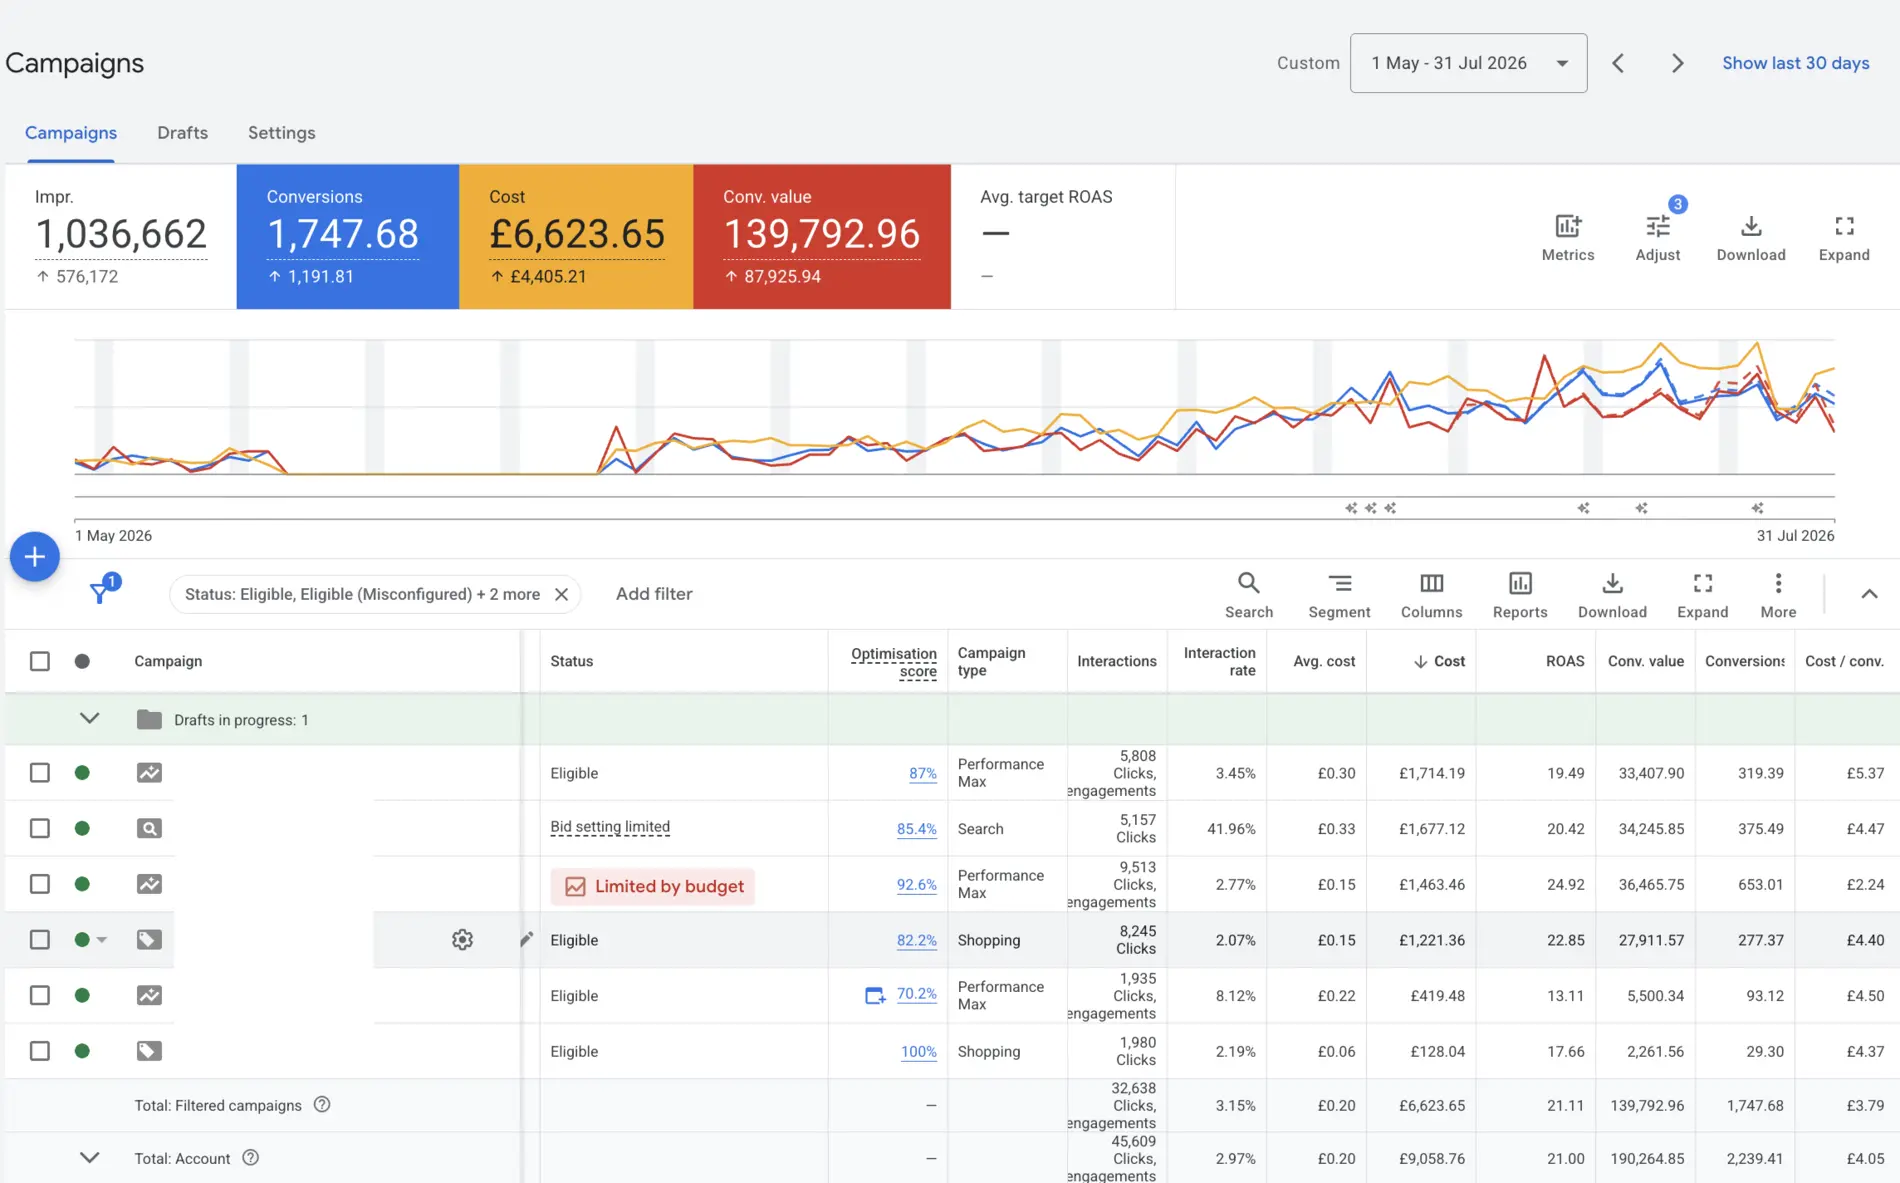
Google Ads · E-commerce1 May–31 Jul 2026
£6,623.65 cost, £139,792.96 conversion value and 21.11 platform-reported ROAS.
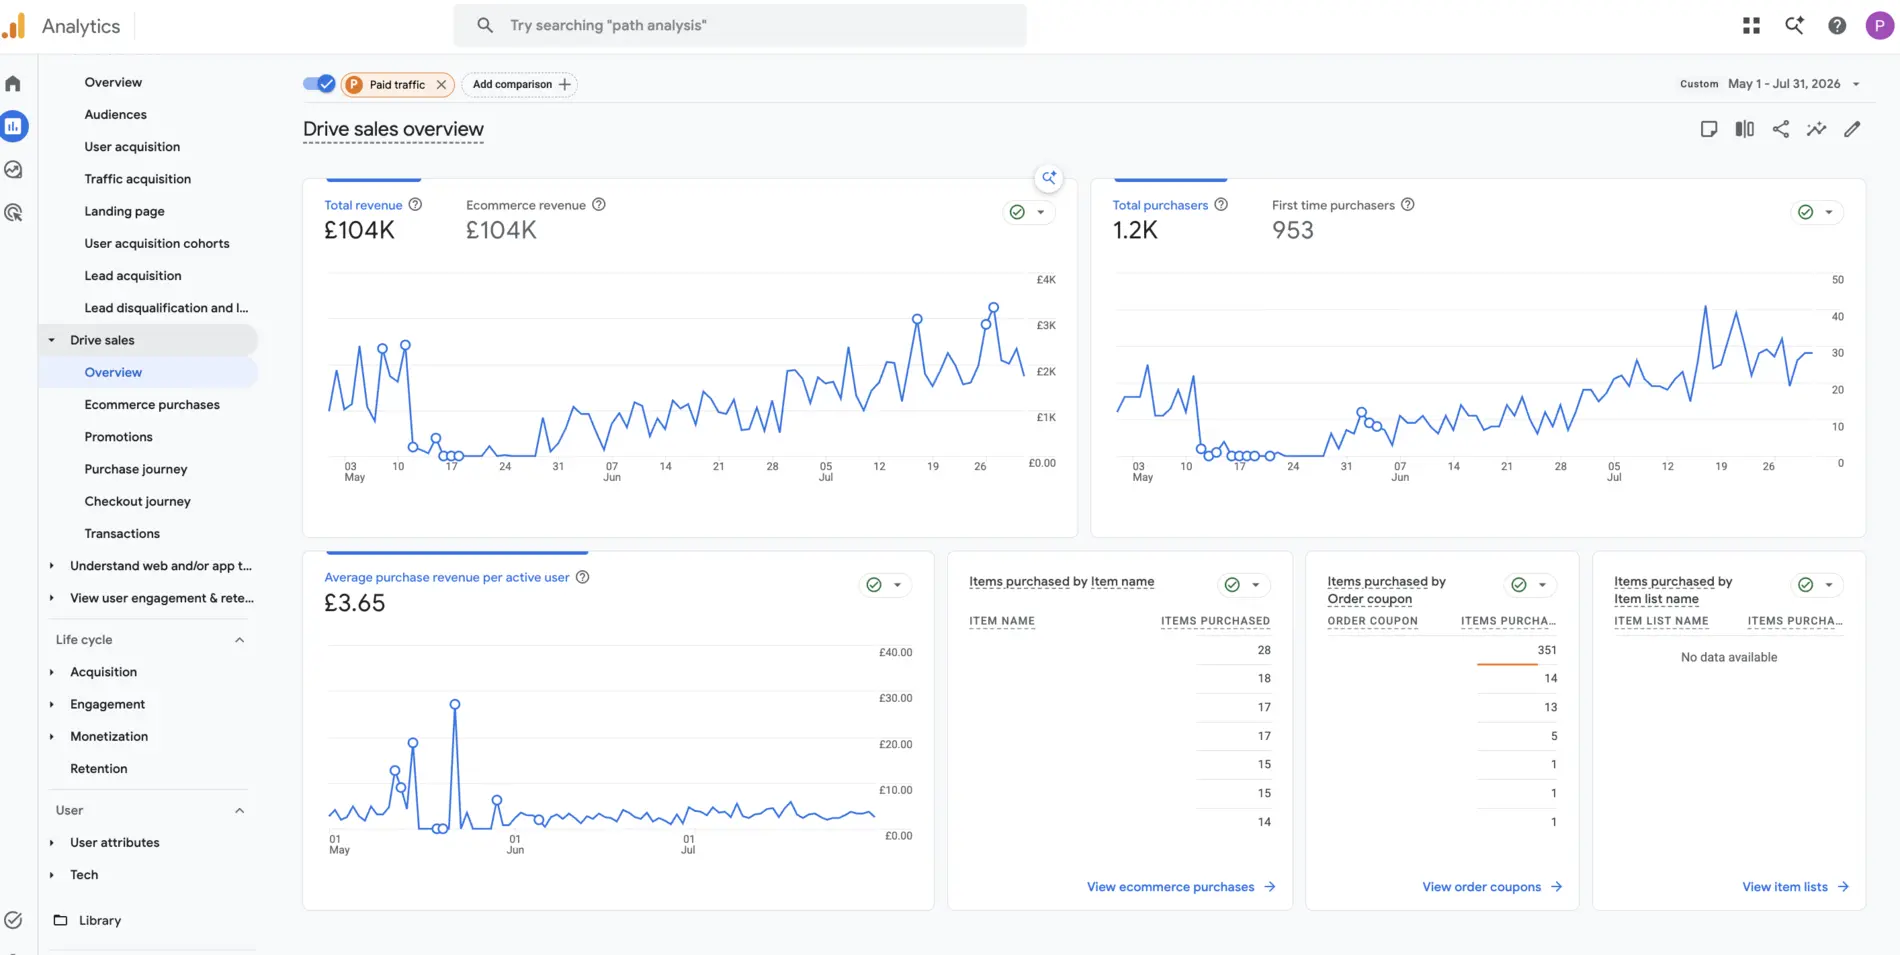
GA4 · E-commerce1 May–31 Jul 2026
£104K total revenue and 1.2K purchasers recorded in the selected view.
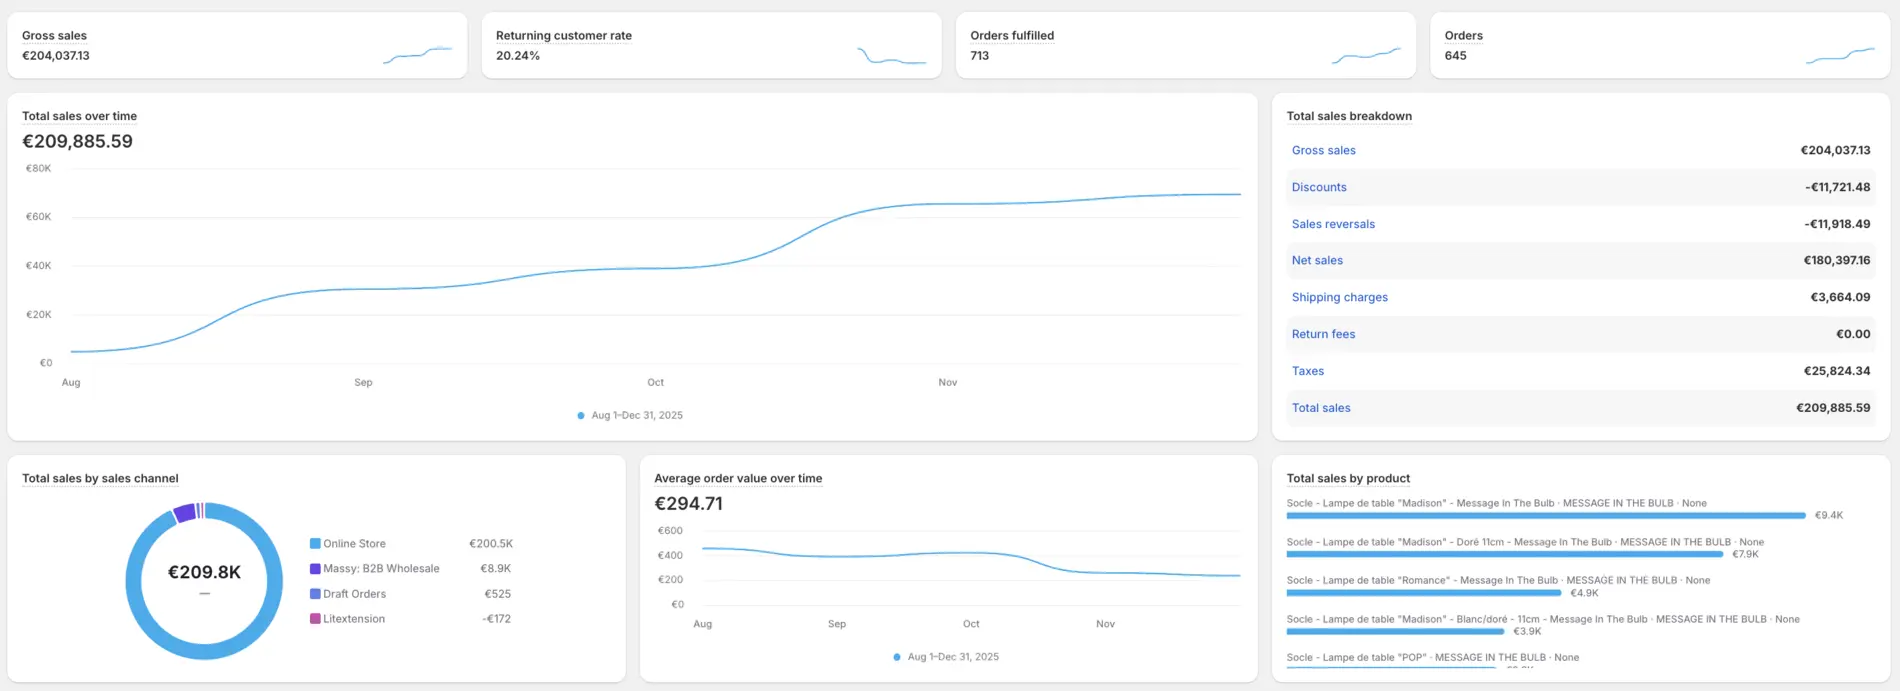
Commerce platform · SalesAug–Dec 2025
€209,885.59 total sales, 645 orders and a 20.24% returning-customer rate.
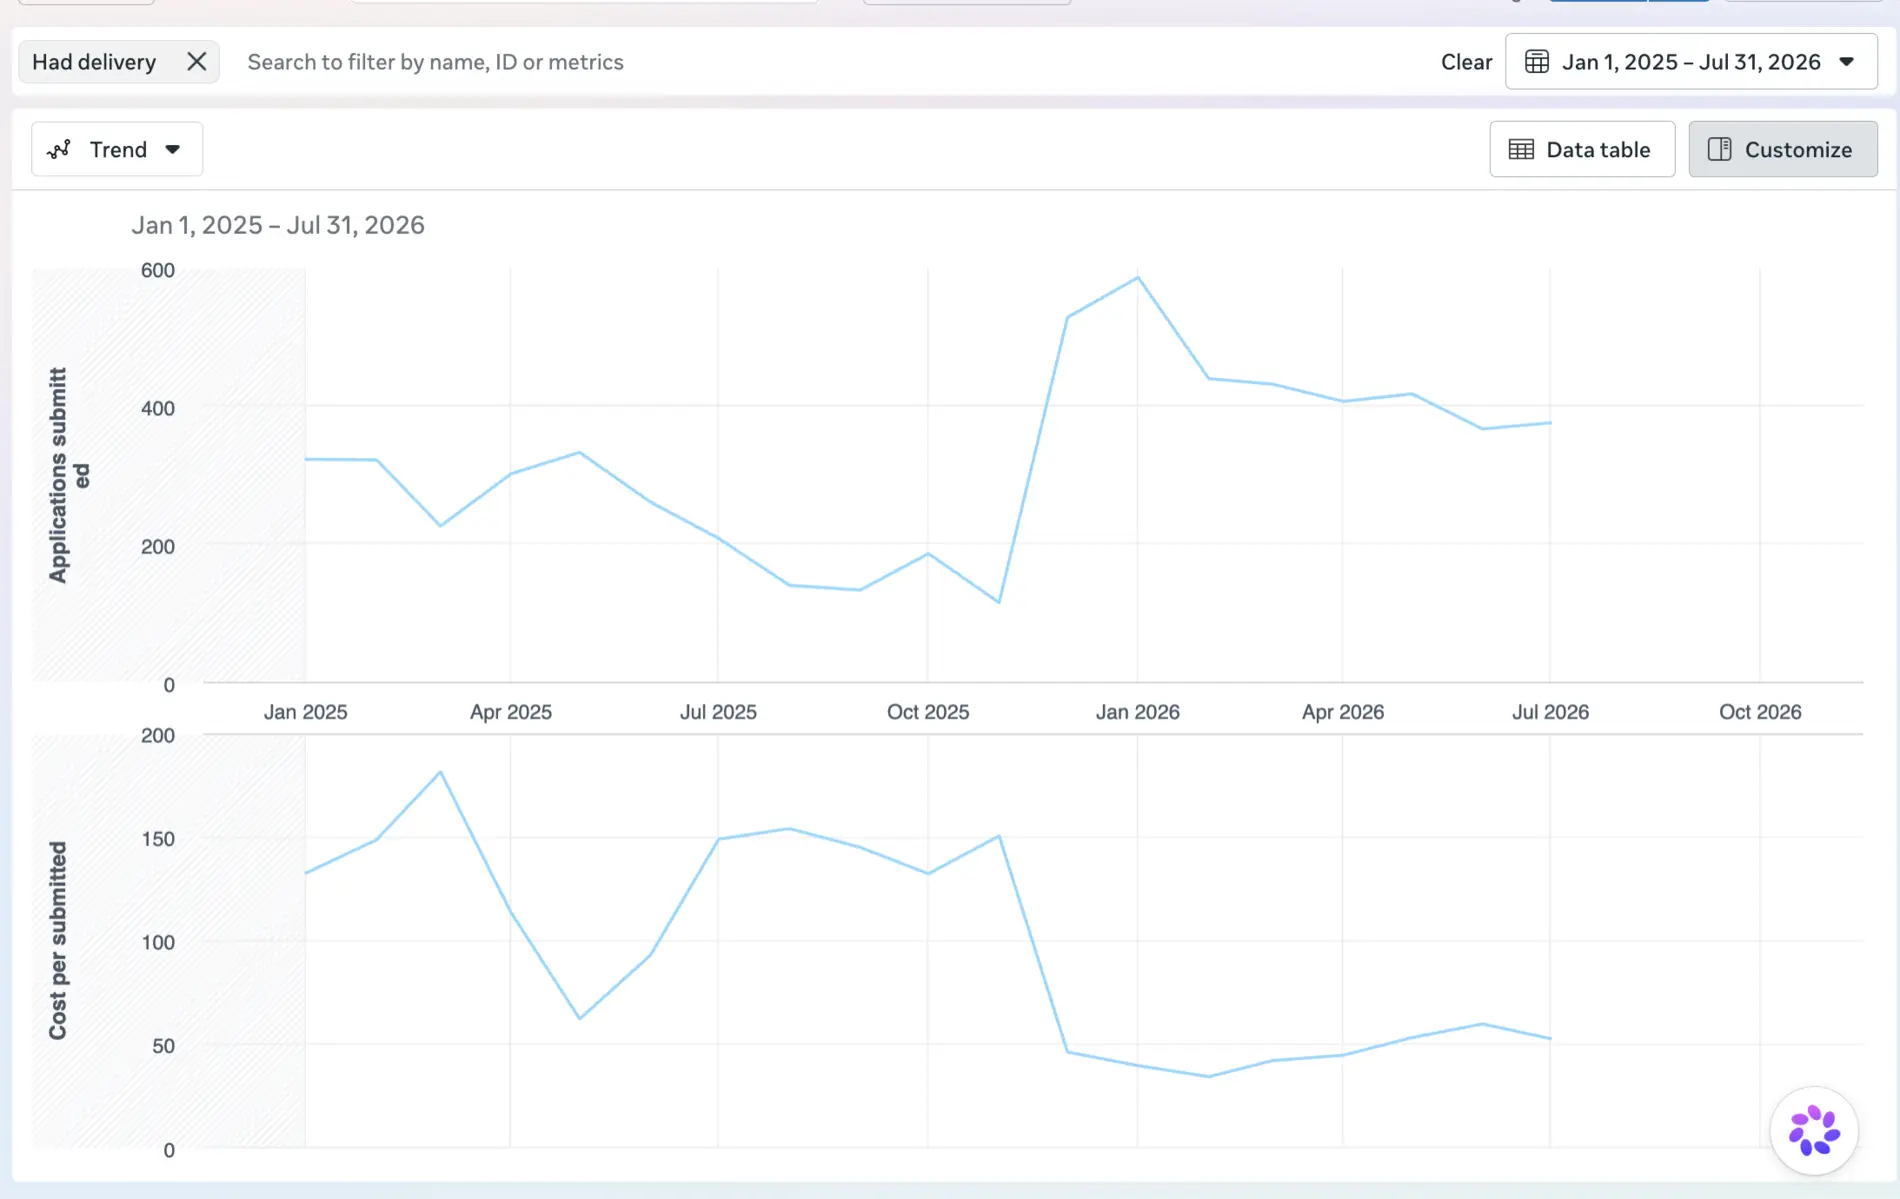
Meta Ads · ApplicationsJan 2025–Jul 2026
Submitted-application volume and cost per submitted application shown together.
Meta Ads · Lead generationJan–Sep 2025
Monthly lead delivery and CPL trend from an anonymised education account.
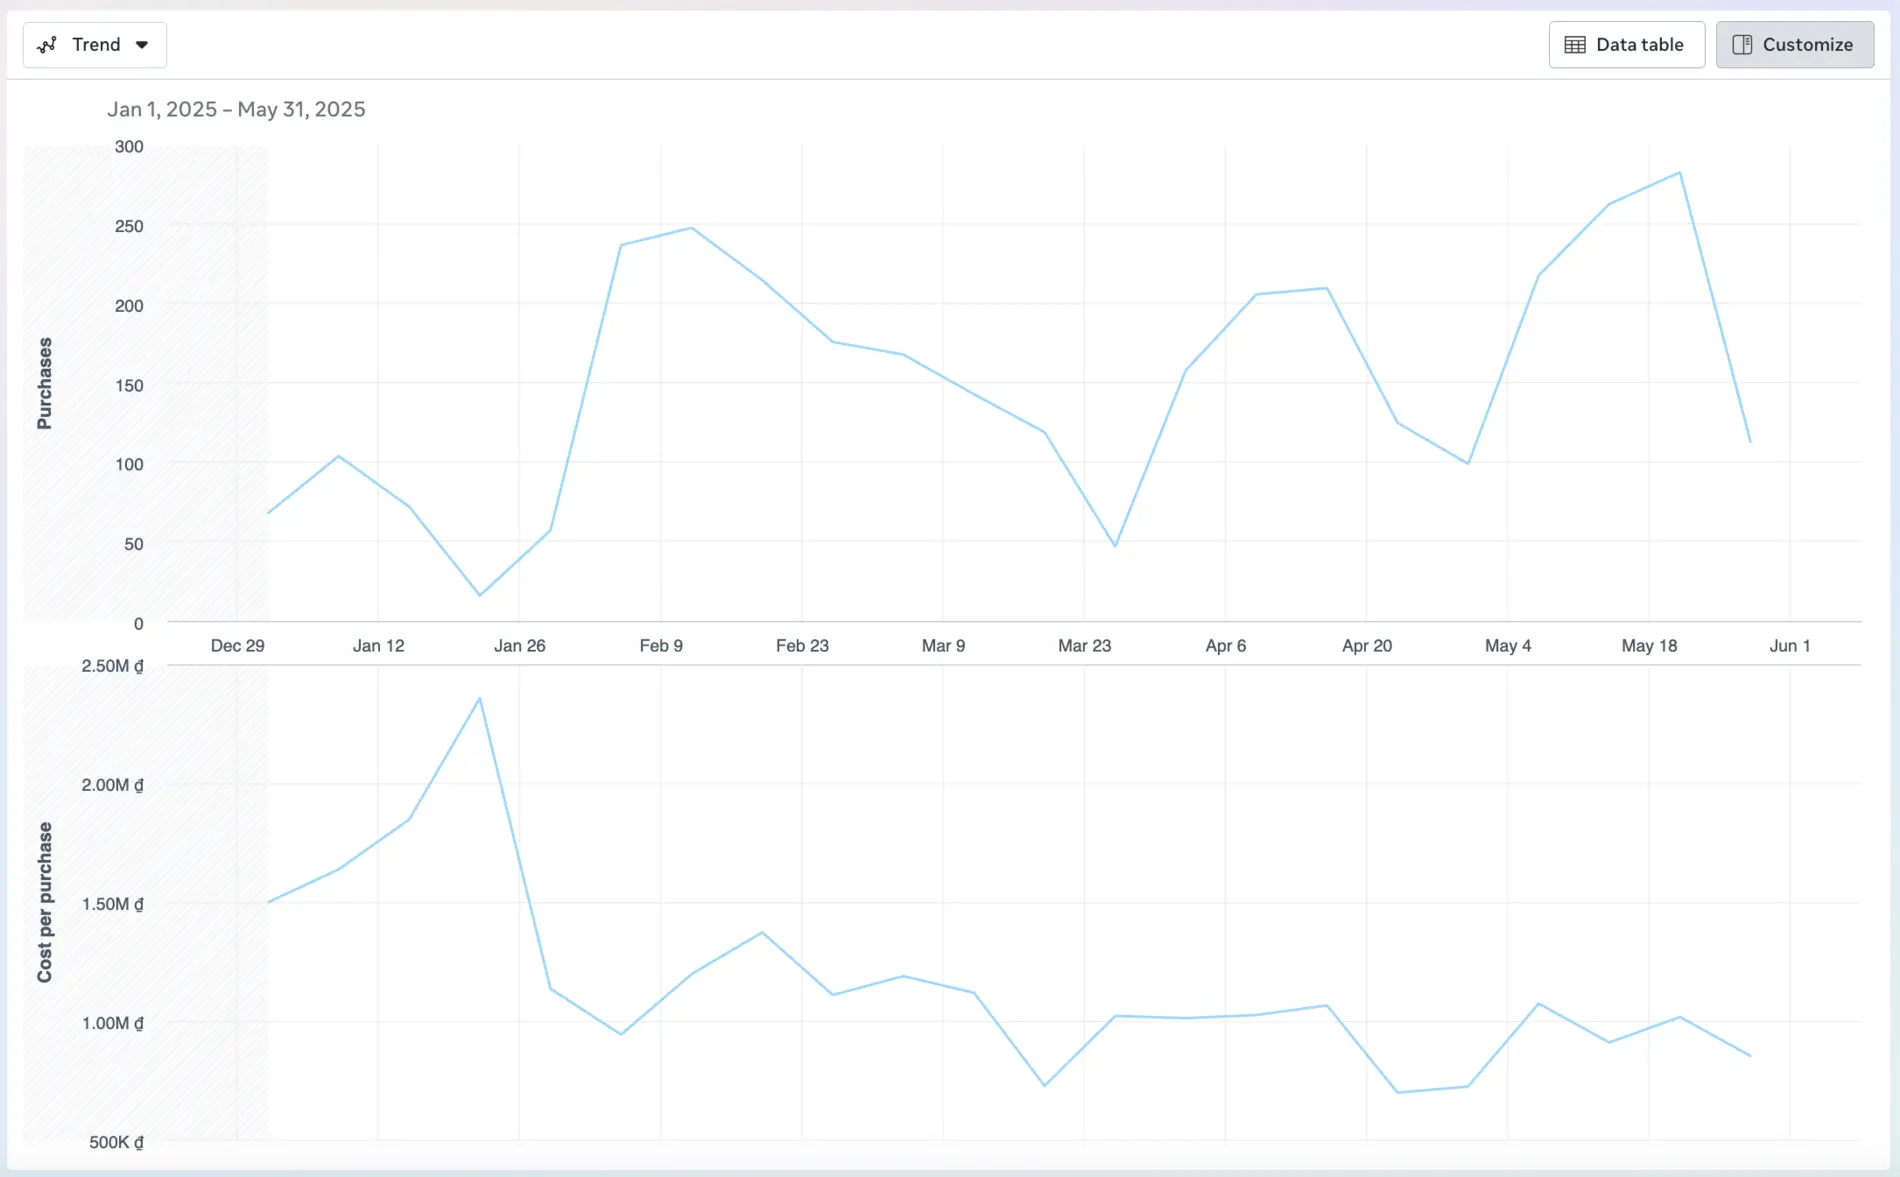
Meta Ads · PurchasesJan–May 2025
Purchase volume and cost per purchase shown on the same account trend.
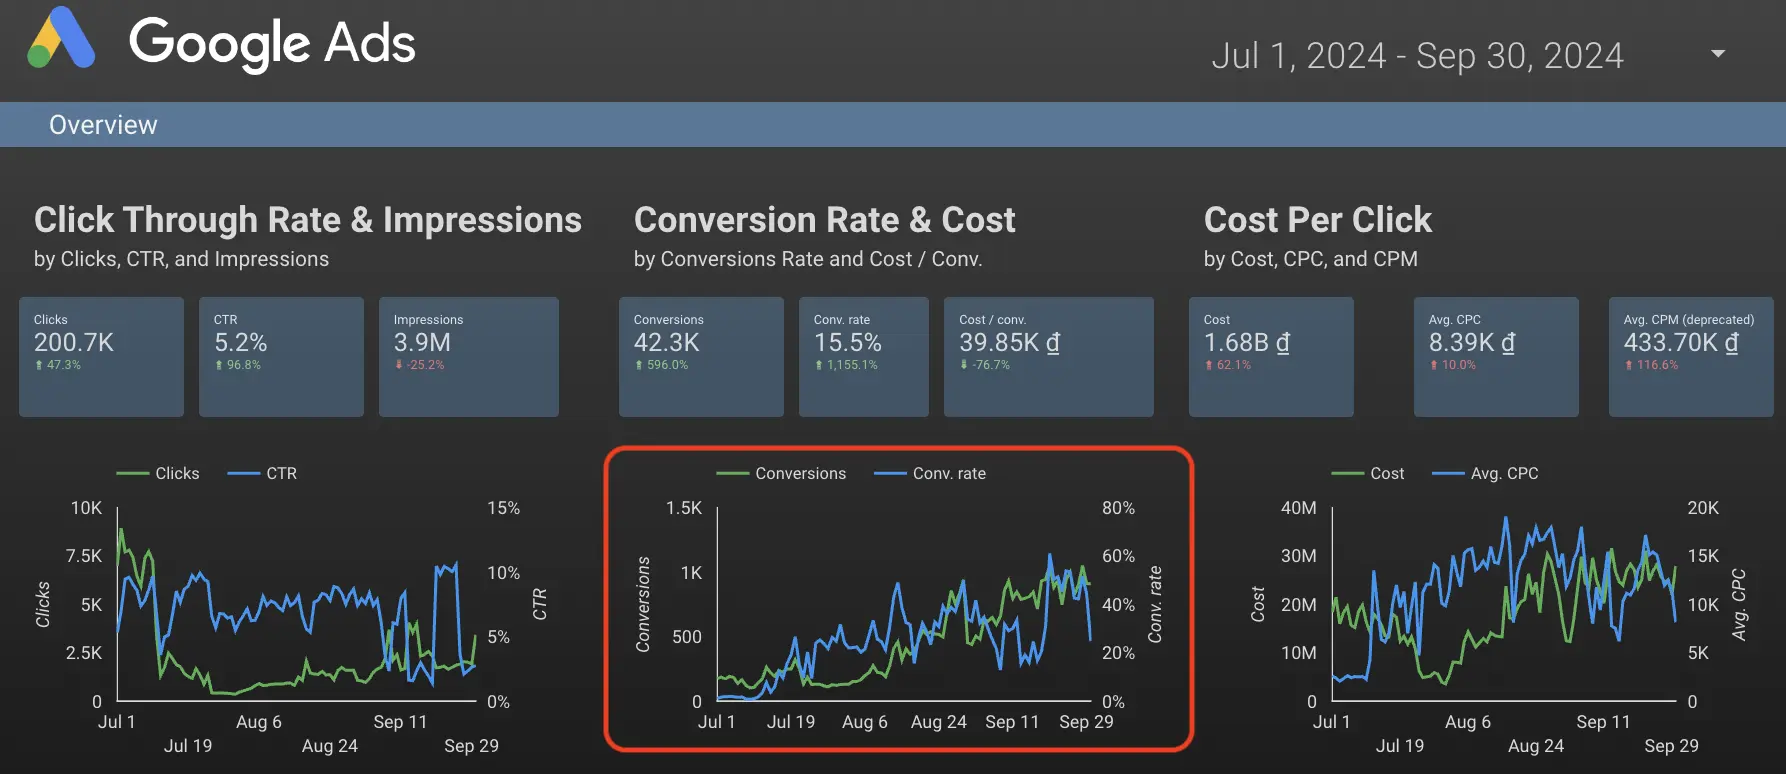
Google Ads · Conversion growthJul–Sep 2024
42.3K recorded conversions and a 15.5% conversion rate in the source dashboard.
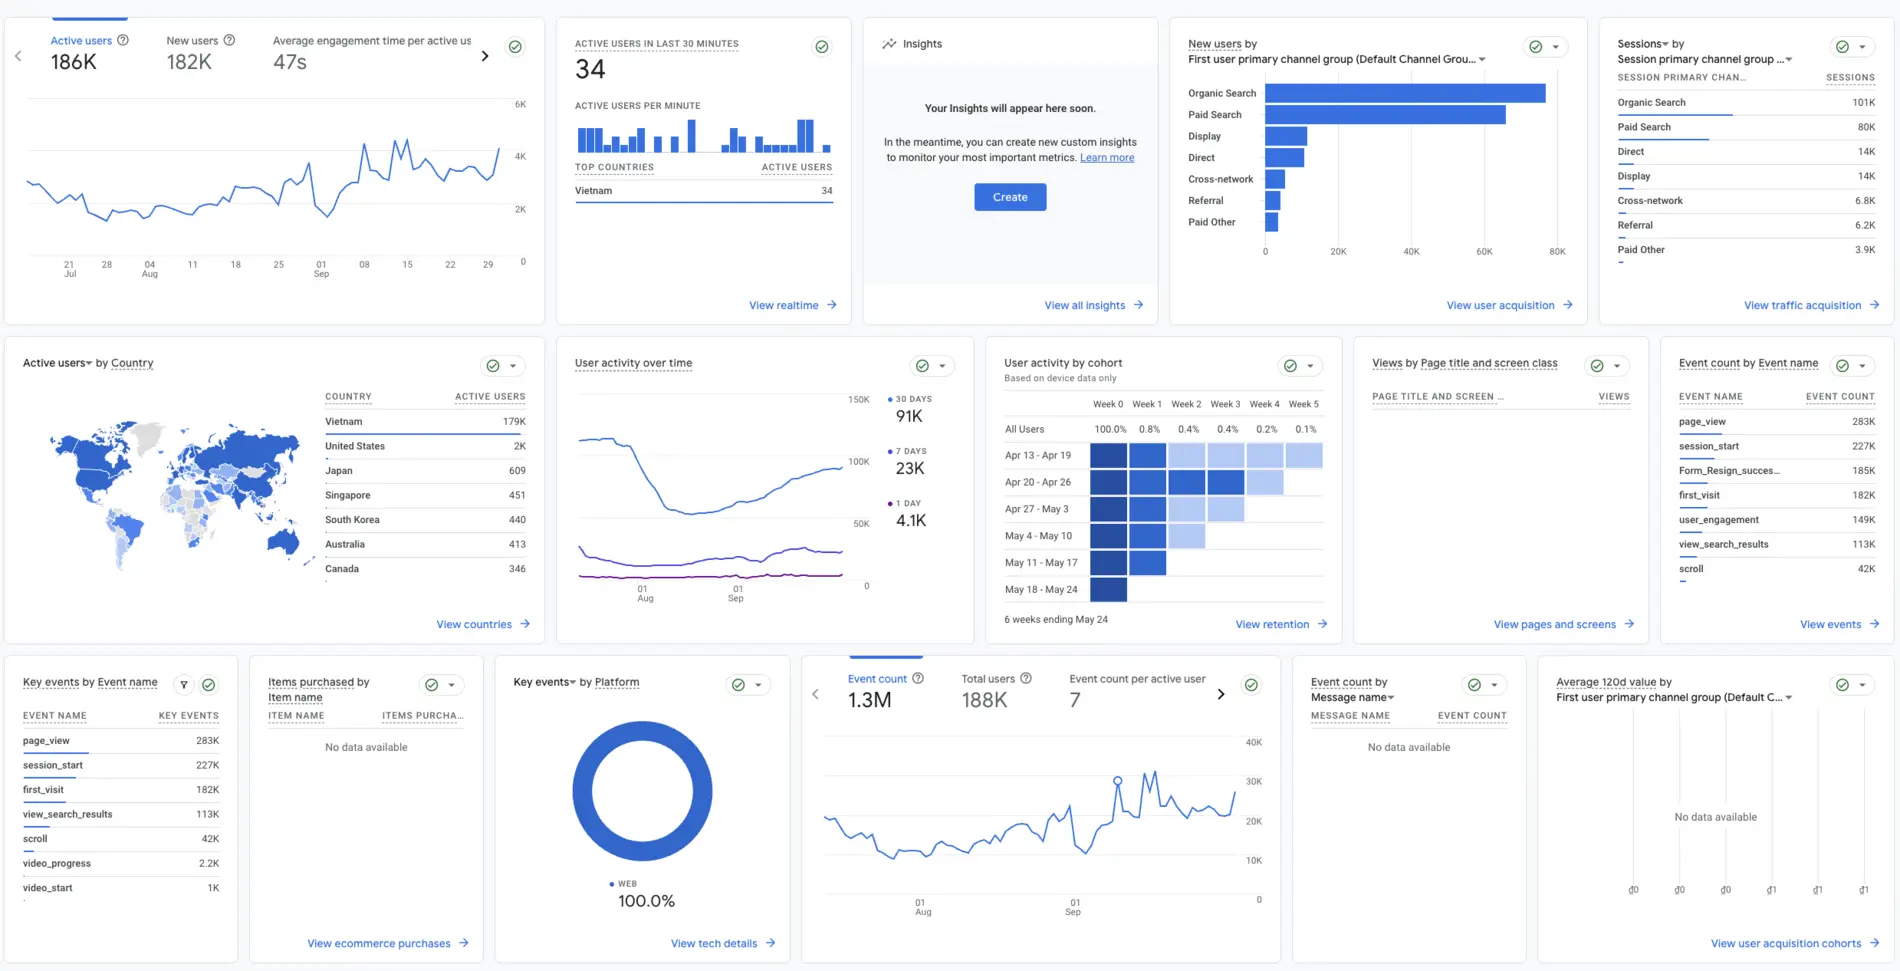
GA4 · Acquisition & behaviourPortfolio snapshot
186K active users, 182K new users and 1.3M recorded events in the selected view.
Currency, attribution windows and conversion definitions differ by platform and account. I do not combine unlike metrics into a single blended claim. See the editorial and evidence policy.
Free 48-hour audit
Bring me the growth problem that does not fit neatly inside one ad platform.
Share your account context and bottleneck. I’ll identify the three highest-impact opportunities—without a sales deck.
 Performance dashboard
 Performance dashboard
 Performance dashboard
 Measured lower-funnel results
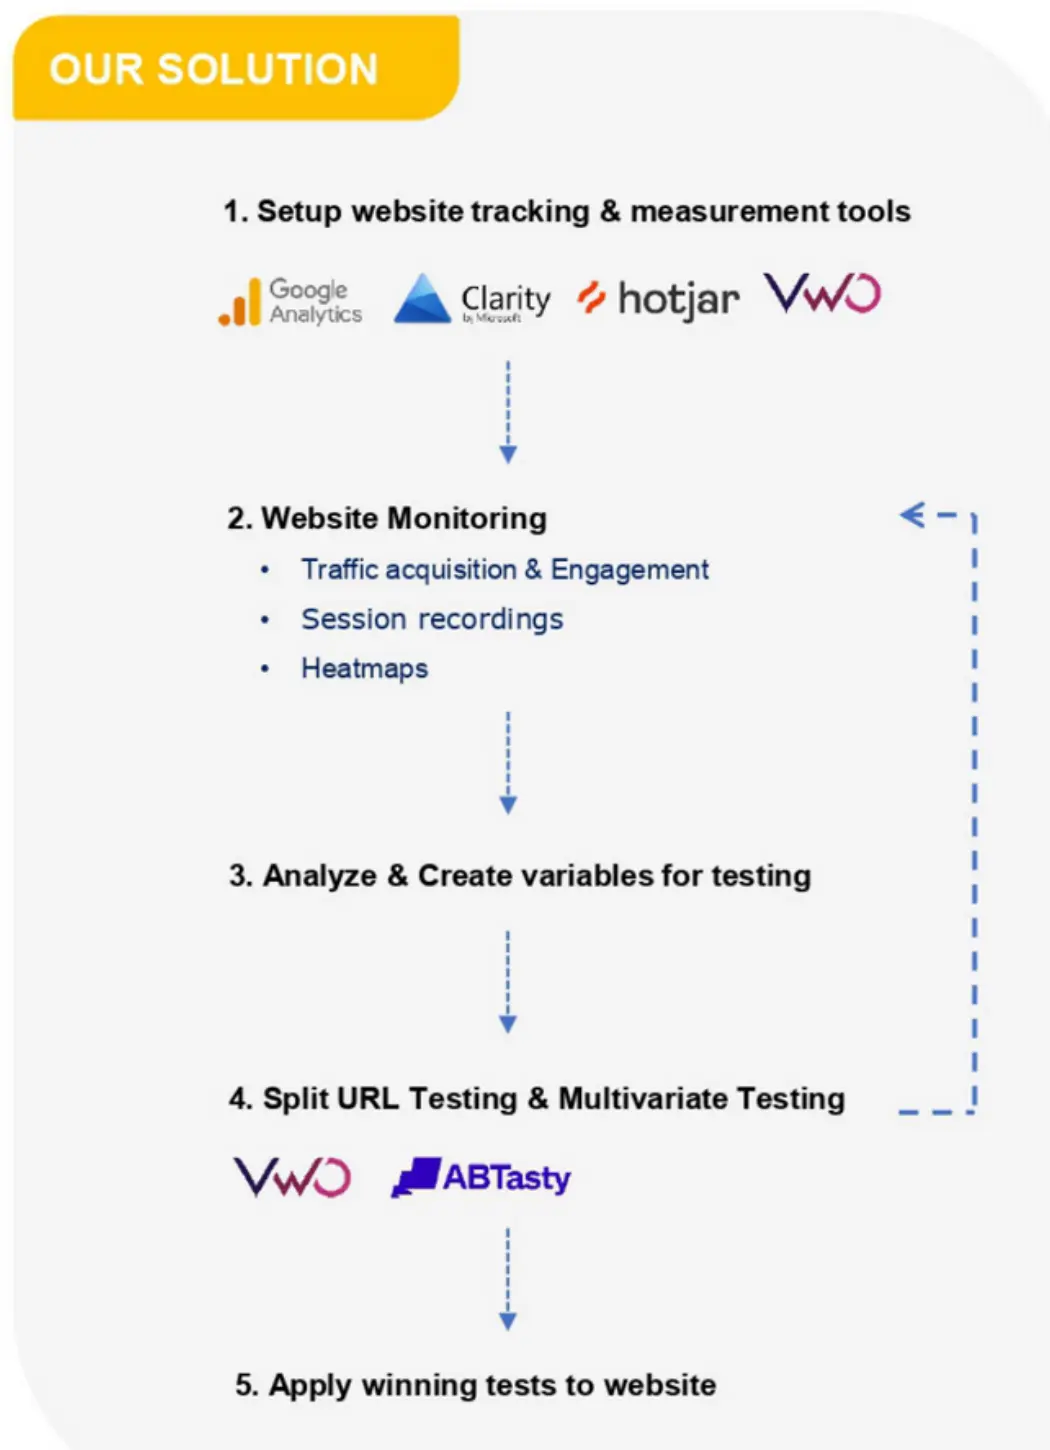 Tracking and CRO workflow
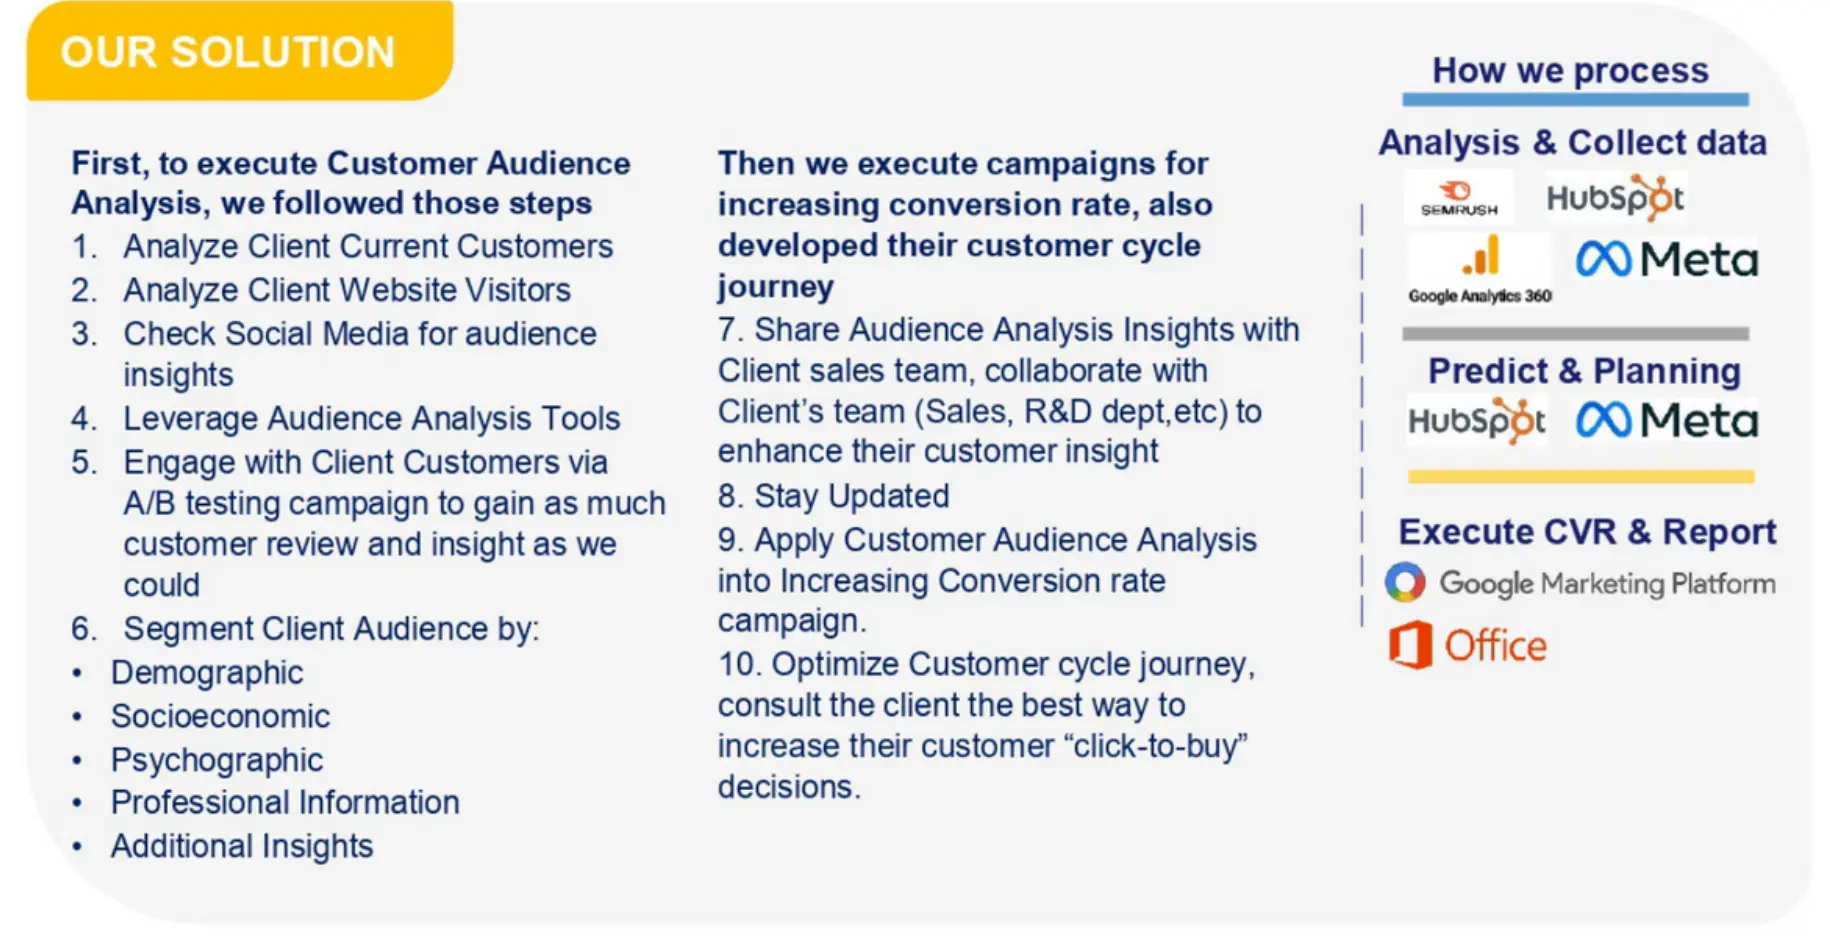 Audience analysis method
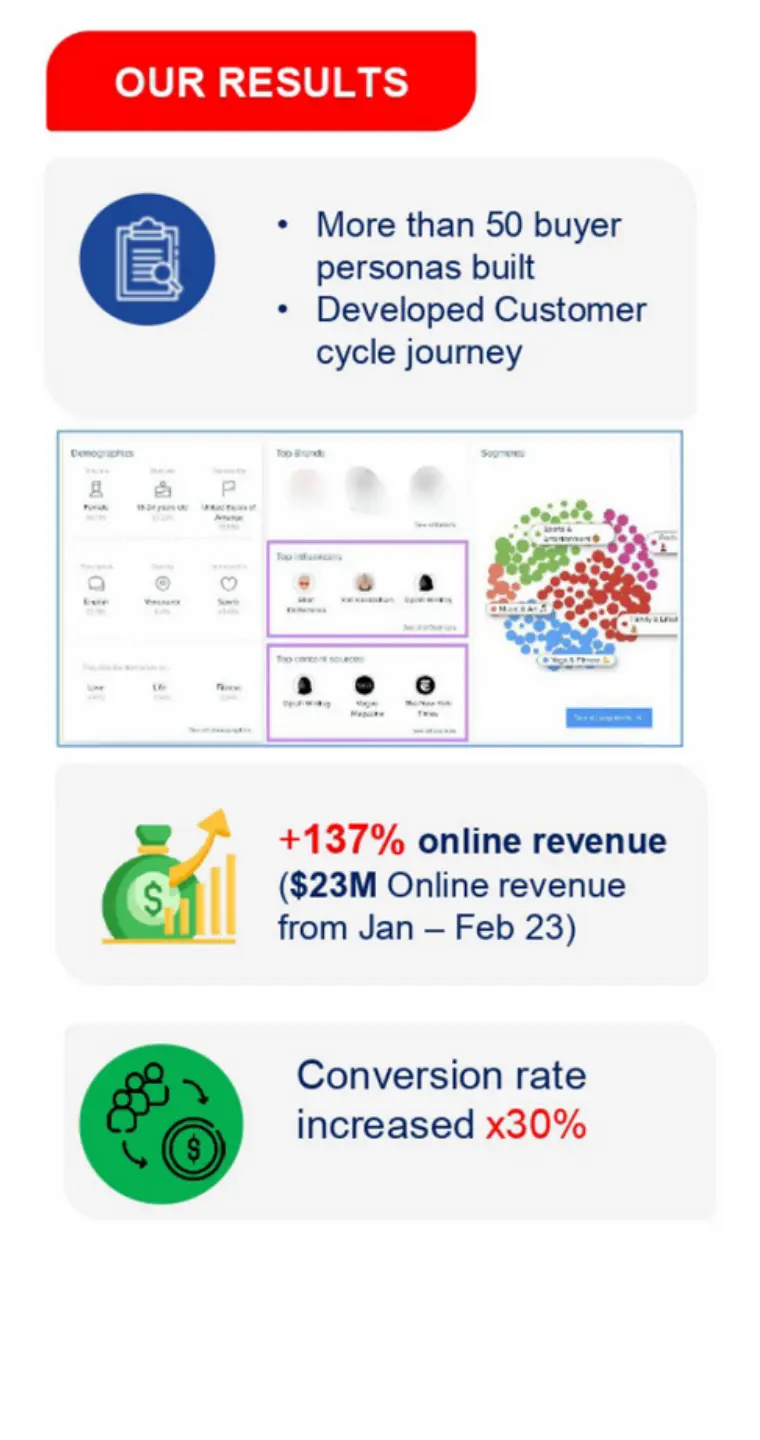 Customer intelligence outcomes
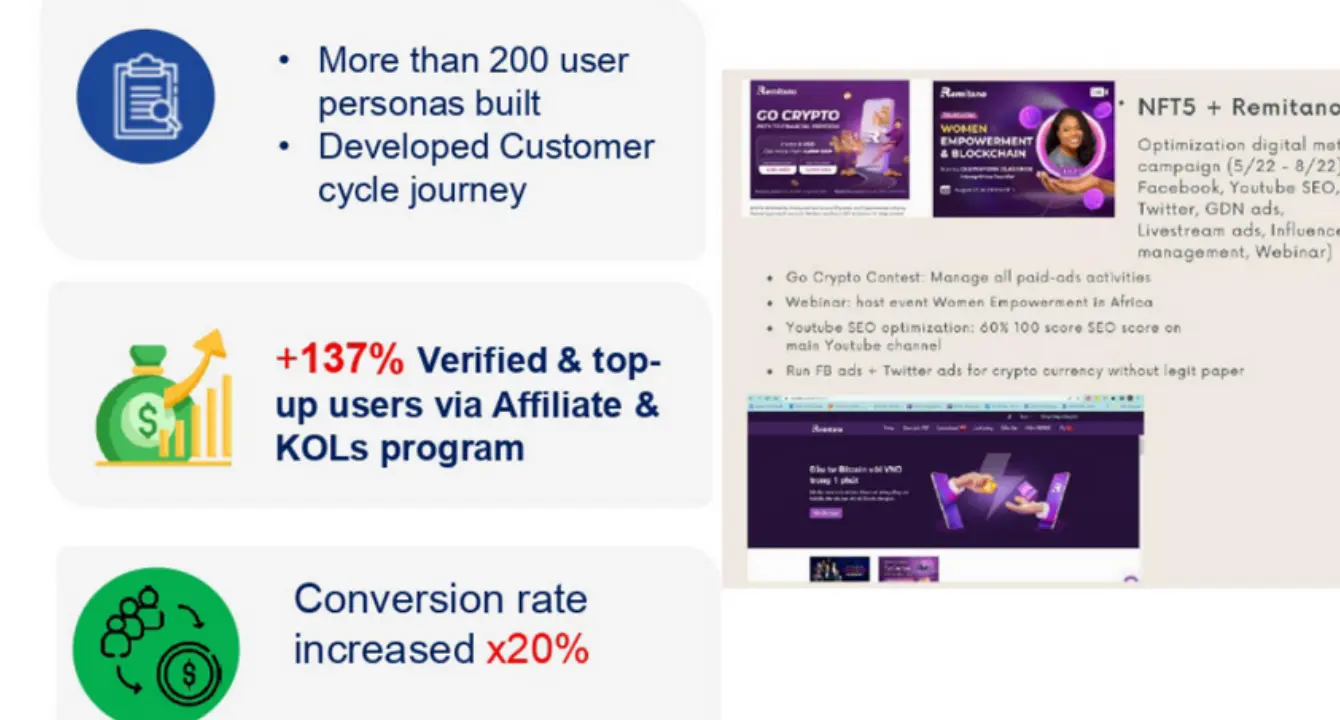 User and partner growth outcomes
 Direct scope of work
 Search performance evidence
 Search growth operating model