E-commerce CPA solution
Your cost per purchase is increasing. Do not blame the algorithm yet.
Separate auction cost, creative fatigue, traffic expansion, product-page conversion and offer economics before reducing spend or rebuilding the account.
Best suited to e-commerce brands spending $3K+/month · Direct with Thomas · No retainer pitchA rising cost per purchase comes from one or more changes in impression cost, click response and purchase conversion. Rebuild that equation for equivalent products, markets and periods, then check whether order value, margin or new-customer mix changed. Fix the component that moved—not the blended CPA headline.
Client evidence · DTC Meta Ads
Purchase volume recovered as cost per purchase fell.
In this anonymised DTC account from my work portfolio, weekly purchases recovered from below 20 at the July low to roughly 80 by late September while cost per purchase moved from above $60 to approximately $15–$20.
Read the full client case →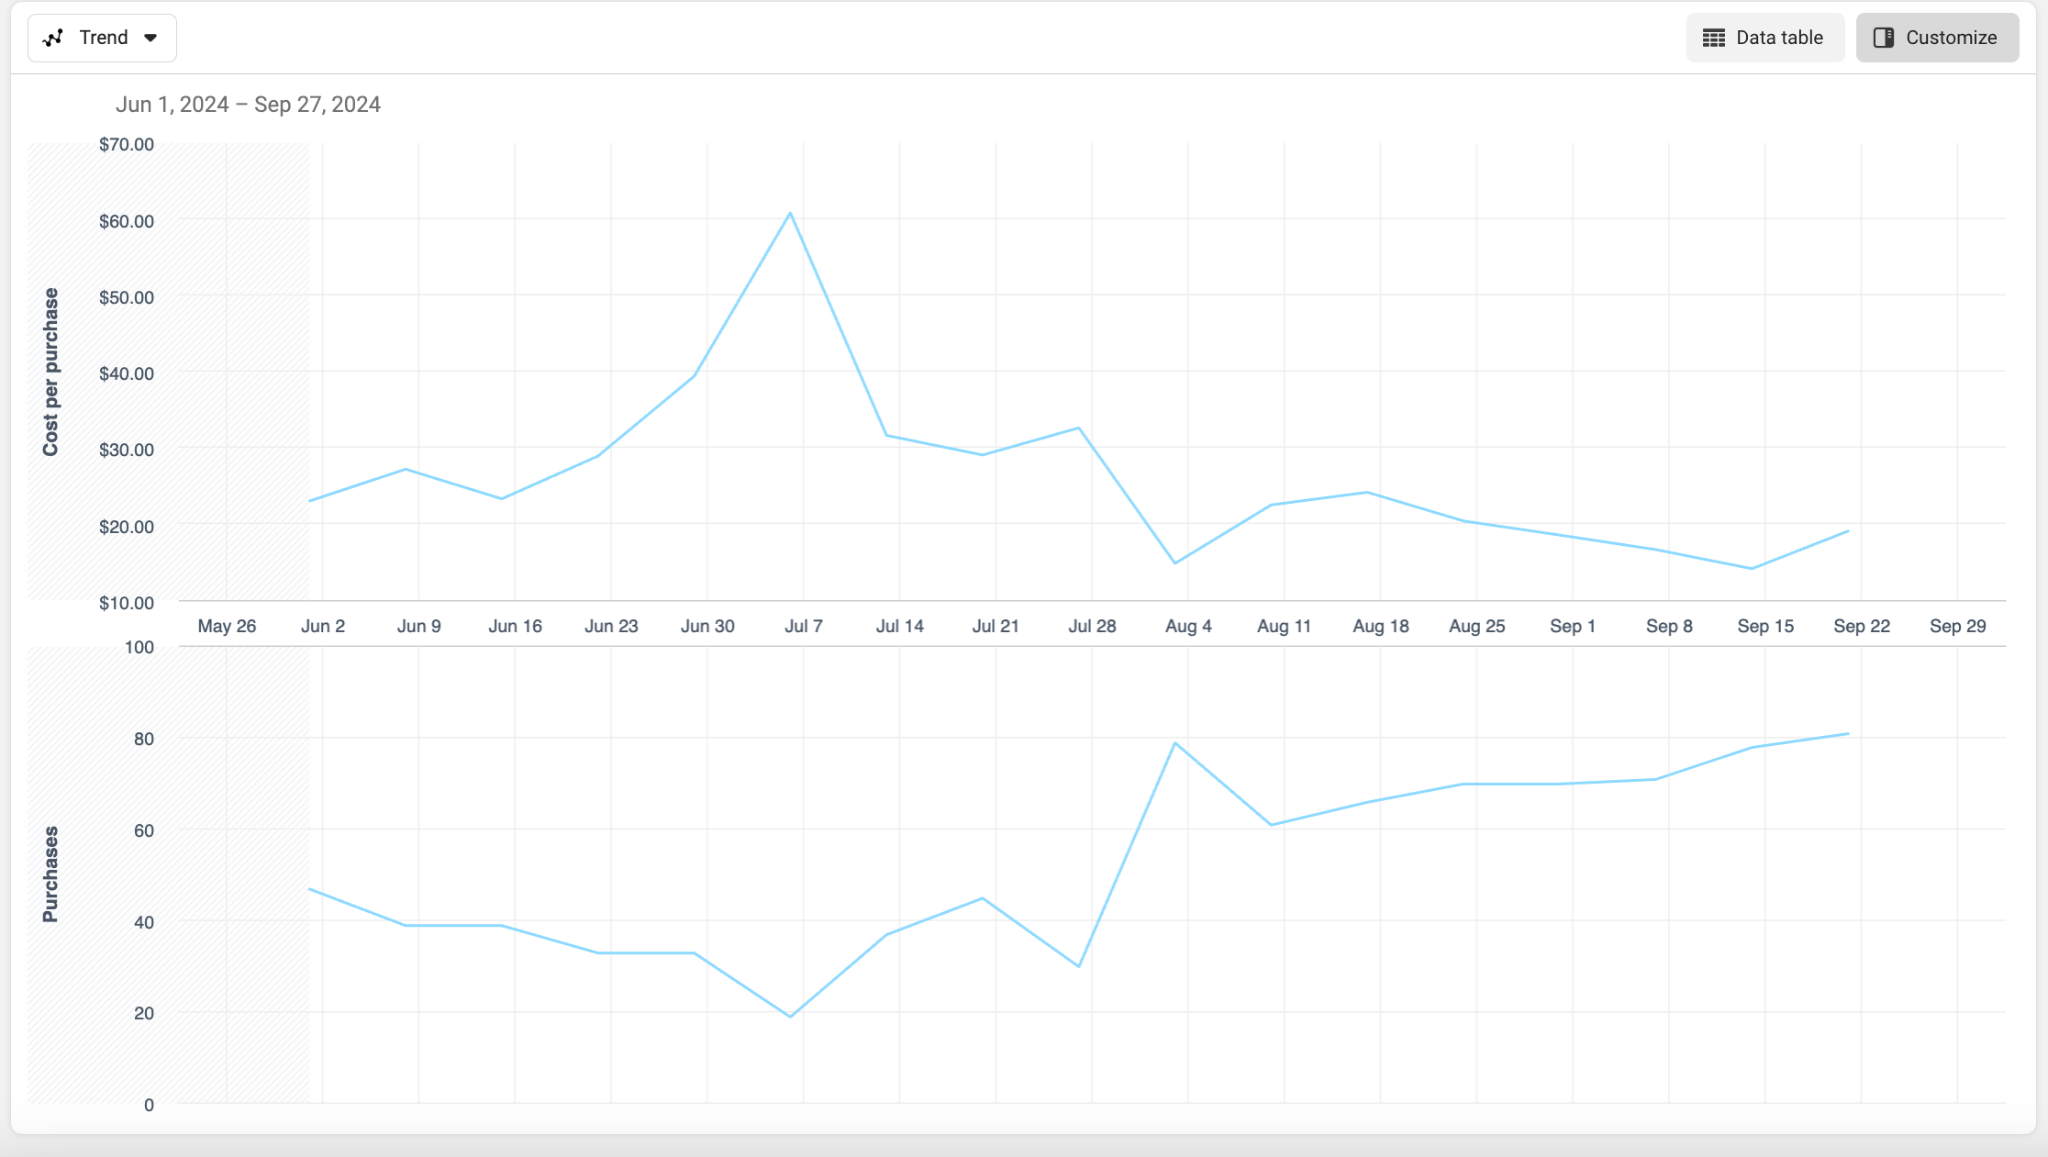
What this looks like
Recognise the symptom before choosing the fix.
Spend holds; purchases fall
The account may be paying more for reach, earning fewer qualified clicks or converting a smaller share of paid sessions.
Every budget increase raises CPA
Additional spend reaches weaker audiences, placements, products or creative combinations before the account has a repeatable next pocket of demand.
Blended CPA hides opposite movements
Returning customers, brand search, discounts and different product margins can make one blended number look stable while new-customer economics deteriorate.
What may be underneath
The ad account may be reporting the symptom—not the cause.
The same attention costs more
Seasonality, market competition, audience saturation and placement mix can increase CPM or CPC before onsite performance changes.
The account is buying less qualified response
Fatigue, repeated hooks or weak product demonstration can lower click-through rate or attract people unlikely to purchase.
A smaller share of paid sessions buys
Price, promotion, stock, delivery, landing-page relevance and checkout conditions can move purchase rate independently of media delivery.
The account is selling different products or customers
New-customer acquisition, expansion markets and lower-margin products can carry a higher CPA than remarketing or existing demand without necessarily being worse investments.
How I diagnose it
Trace one commercial chain before changing everything.
- 01
Rebuild the purchase-cost equation
Compare CPM, click-through rate, CPC and paid-session purchase rate for equivalent products, audiences, devices, markets and dates.
Evidence: A component bridge that quantifies each contribution to the CPA change. - 02
Separate customer and demand types
Split prospecting from remarketing, new from returning customers, brand from non-brand and mature from expansion markets.
Evidence: Spend, orders, revenue and contribution by acquisition role. - 03
Inspect product and offer mix
Check stock, price, discount, AOV, landing destination, shipping promise and margin at SKU or collection level before judging the campaign.
Evidence: Product-level purchase rate, margin and cancellation or return signals. - 04
Recover the highest-confidence loss
Remove measurable waste or repair the weakest conversion layer, then retest without changing several variables at once.
Evidence: Named owner, expected mechanism and review threshold for each action.
Decision map
Match the observed pattern to the first useful action.
| Observed pattern | What it may mean | First decision |
|---|---|---|
| CPM rises; response and purchase rate hold | Auction or market pressure | Protect profitable demand and test bid, placement or market boundaries |
| CTR falls; onsite purchase rate holds | Creative fatigue or weak relevance | Refresh product demonstration and buying angle |
| Clicks hold; purchase rate falls | Offer, product page or checkout problem | Inspect the post-click journey before changing bids |
| CPA rises; AOV or margin rises more | Potentially healthy mix change | Judge contribution per order, not CPA alone |
| CPA and contribution both worsen | Real acquisition loss | Recover waste and retest the weakest component |
This is a diagnostic map, not a universal benchmark. The correct decision depends on your offer, market, buying journey, data quality and starting point.
Free 48-hour written audit
What you receive.
For accounts spending $3K+/month, I review the available media, conversion and commercial context and return the three highest-impact opportunities. No commitment. No retainer pitch.
Request the diagnostic →- CPA component bridge by channel and period
- New, returning, prospecting and remarketing split
- Creative fatigue and response analysis
- Product and landing-page conversion review
- Three recovery actions with stop, hold or scale thresholds
Best fit
This diagnosis works when evidence can change a decision.
Strong fit
- DTC and e-commerce brands with consistent purchase volume
- Accounts spending $3K+/month
- Access to revenue, product and paid-media data
- Teams able to change creative, offer or onsite conversion
Not designed for
- A single bad day without enough purchase volume
- Stores measuring only platform ROAS
- Products without known unit economics
- A request to guarantee a target CPA
Practical questions
Questions that change the diagnosis.
Why is my Facebook Ads cost per purchase increasing?
The increase usually comes from higher impression cost, lower creative response, weaker traffic quality, lower website purchase rate or a different product and customer mix. Compare those components for equivalent periods before changing budget.
Should I reduce budget when CPA rises?
Reduce or pause only when contribution economics breach a defined limit and the pattern has enough evidence. A sudden budget cut can remove volume without repairing creative, conversion or offer problems.
What is a good cost per purchase for e-commerce?
A workable CPA depends on selling price, product cost, fulfilment, payment fees, returns, discounting and expected repeat purchase. The correct ceiling is your own allowable acquisition cost, not an industry average.
How do I know whether creative fatigue is causing the increase?
Look for declining response within comparable audiences while CPM, landing destination and purchase rate remain relatively stable. Frequency alone is not proof; creative-level spend, response and purchase progression provide stronger evidence.