
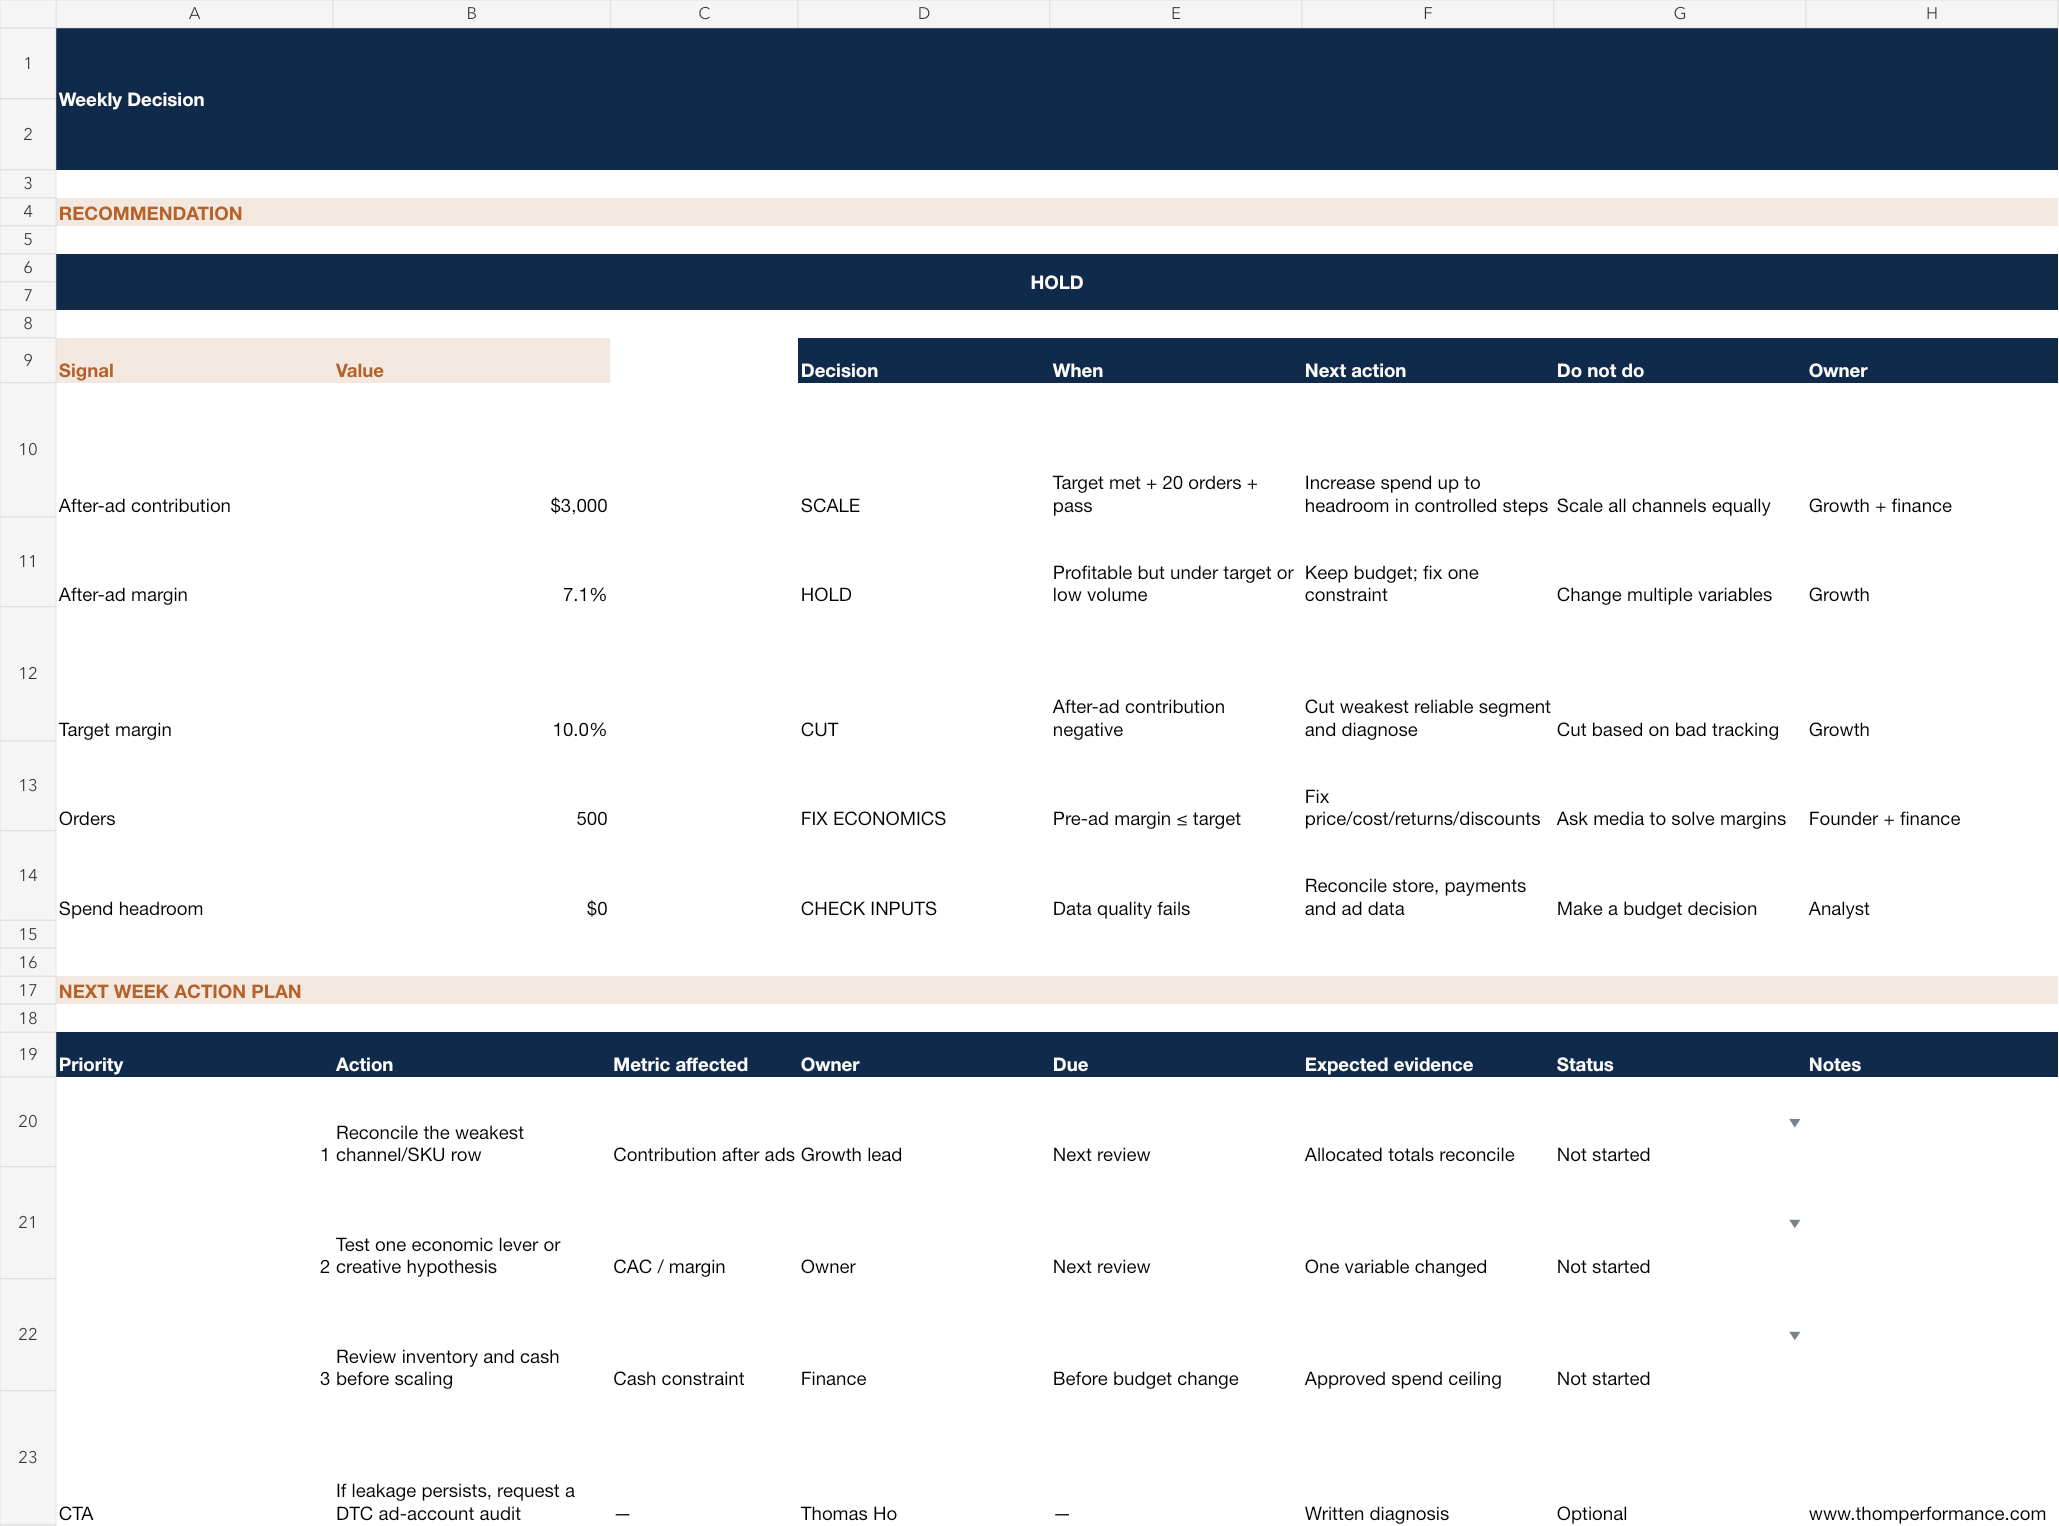
Hold spend in the worked example: platform ROAS is 4.17x, but after-ad contribution is only $3,000 (7.1% of net revenue), below the 10% target with no profitable headroom.
Use this resource when
Download the working file.
This is the complete editable template—not a PDF preview. Add your own account data, owners and decisions.
Reconcile the commercial baseline
Start with net revenue, COGS, fulfilment, payment fees, returns, discounts, ad spend and order counts for one complete week. The workbook keeps currency, time period and definitions visible so channel totals cannot quietly drift away from store reality.
- Use net revenue after discounts and returns
- Use one complete reporting week
- Reconcile channel revenue with the store total before deciding
Read contribution after advertising
The workbook calculates gross profit before ads, contribution after ads, contribution margin, allowable acquisition cost and headroom. This prevents a strong platform ROAS from masking weak fulfilment, product or discount economics.
Separate channel and SKU decisions
Enter revenue, spend, orders, new customers and variable costs by channel or SKU. Use the view to find where attractive blended economics hide a weak acquisition source or low-margin product mix.
- Compare CAC with allowable CAC
- Inspect contribution dollars as well as margin
- Keep returning-customer revenue separate when it changes acquisition economics
Use the SCALE / HOLD / CUT rule
The final sheet turns the reconciled economics into one weekly decision and records the reason, owner, next action and reversal condition. SCALE requires the target margin and positive headroom; HOLD protects learning when economics are close; CUT flags clearly unprofitable spend.
Practical questions
Questions that change the decision
Is this a MER or ROAS calculator?
It includes those signals, but its purpose is the weekly profit decision. Contribution after advertising, target margin and headroom determine the verdict.
Can I use it when I sell multiple products?
Yes. Use the Channel & SKU View to separate product or channel economics, then reconcile the total to store net revenue.
Are the worked-example numbers benchmarks?
No. They are clearly labelled illustrative values that demonstrate the formulas and decision rules.