
Different totals are a diagnosis prompt, not automatic proof that tracking is broken
An ecommerce owner usually sees at least three versions of revenue: the amount credited by an advertising platform, the amount recorded by website analytics and the amount captured by the commerce or payment system. They are related, but they are not designed to answer exactly the same question.
The advertising view asks which campaigns should receive credit under its attribution rules. The analytics view explains observed customer journeys according to its own collection and attribution settings. The commerce ledger records orders and payment activity, but even that view needs a clear treatment of refunds, cancellations, tax, shipping, discounts and currency.
My verdict is: do not pick a favourite dashboard and do not force unlike systems into artificial agreement. Reconcile the definitions, match transactions where possible and use confirmed store value as the financial anchor. Advertising and analytics then become decision lenses—not competing versions of the accounts.
The evidence that changed the question
In one approved anonymised portfolio view, Google Ads recorded £6,623.65 in cost, £139,792.96 in conversion value and 21.11 platform-reported return on ad spend from 1 May to 31 July 2026. A GA4 ecommerce view for the same stated dates recorded £104K total revenue and 1.2K purchasers.
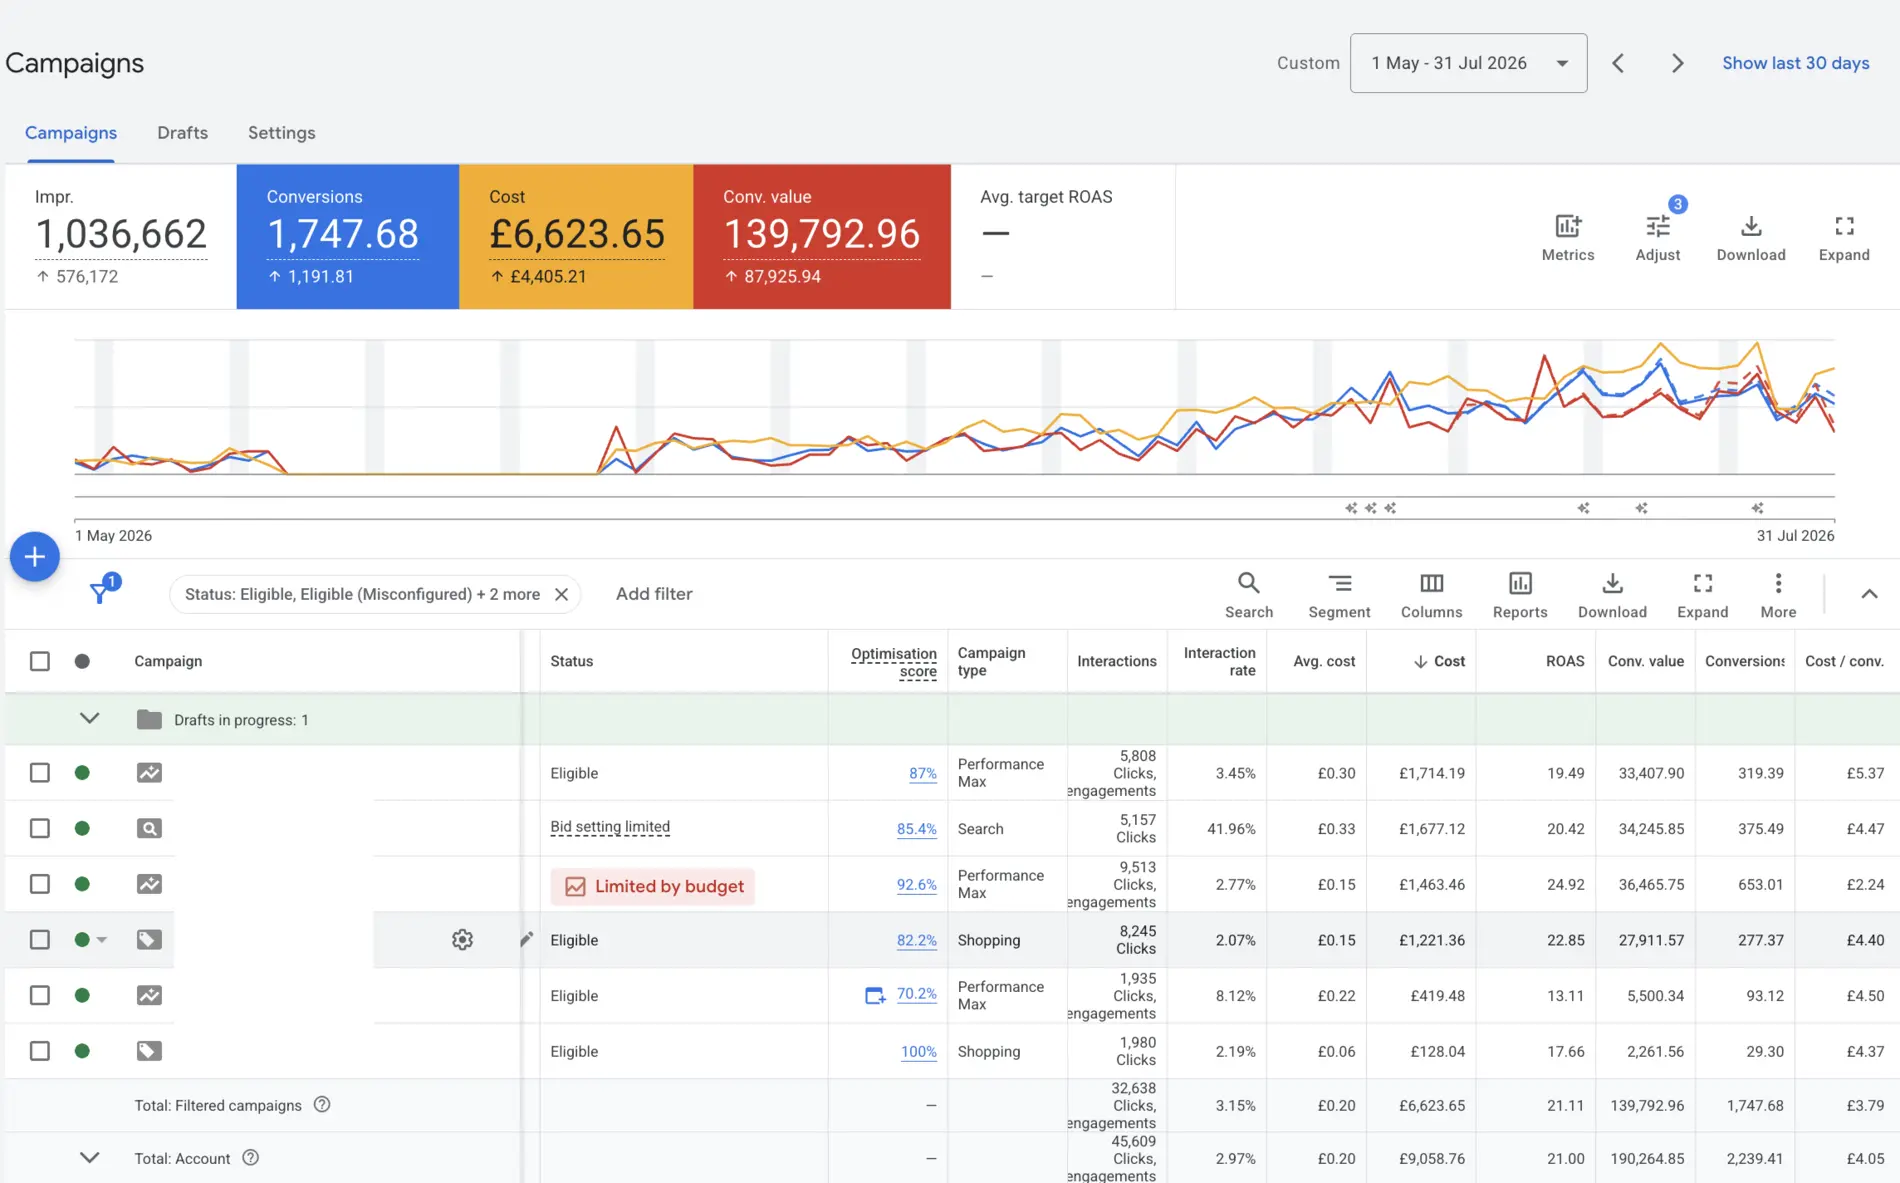
Google Ads, 1 May–31 July 2026: £6,623.65 cost, £139,792.96 conversion value and 21.11 platform-reported ROAS. Dashboard labels are shown as captured.
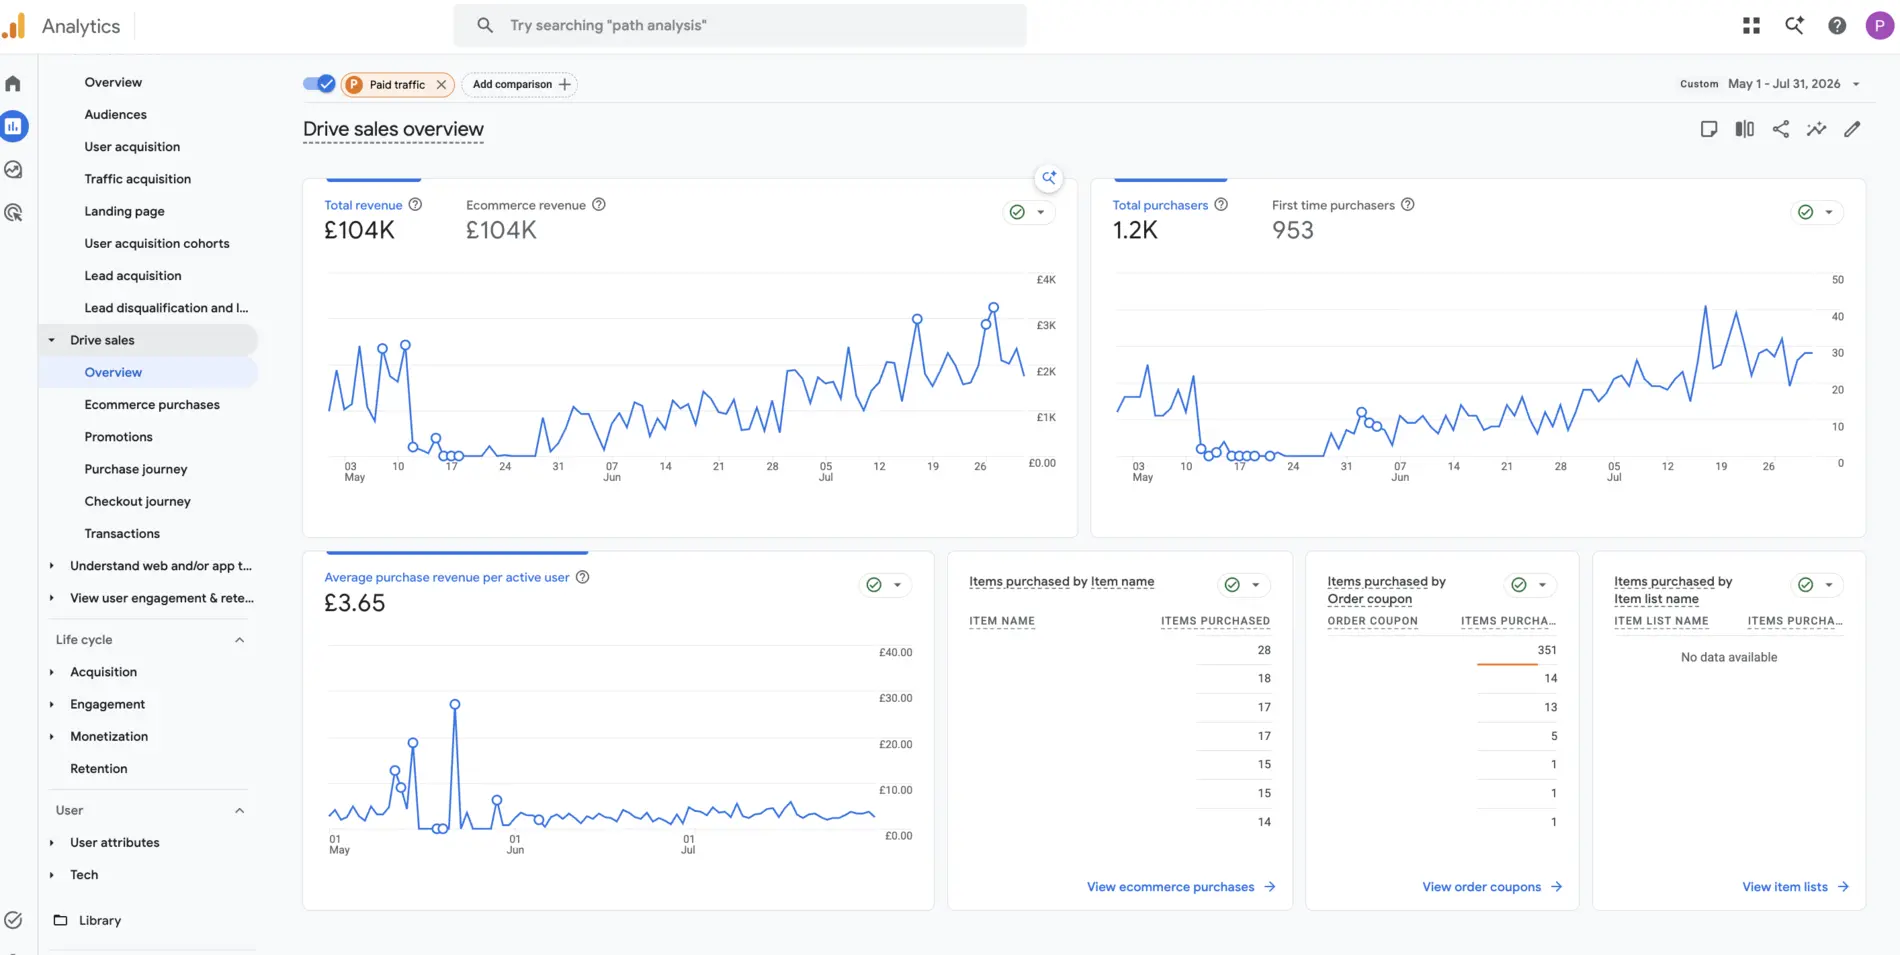
GA4, 1 May–31 July 2026: £104K total revenue and 1.2K purchasers in the selected view. Dashboard labels are shown as captured.
The totals differ materially. The screenshots do not disclose attribution settings, reporting time zones, refund handling, currency treatment or the commerce ledger, so they cannot prove which mechanism caused the gap. Nor do they prove profit, incrementality or a guaranteed outcome. The useful lesson is that an impressive platform return is a hypothesis to reconcile—not cash evidence by itself.
That boundary follows ThomPerformance's evidence standards: label what was observed, separate inference from proof and leave limitations visible.
Why two credible systems can report different revenue
Google states that Google Ads and Google Analytics can attribute key events differently, so reports using the same date range may not match. Attribution decides which interaction receives credit. A conversion window decides how long an interaction remains eligible. Reporting can also assign activity to the click date in one view and the event date in another.
Collection matters too. Consent choices, browser restrictions, cross-device journeys and incomplete tagging can change what analytics observes. Transaction setup matters because a unique order identifier helps deduplicate purchases. Value rules matter because one system may include tax and shipping while another sends product revenue only.
These differences do not make the reports useless. They define their proper roles. A campaign report can help compare acquisition choices. Analytics can reveal journeys and channel interactions. The store ledger confirms what was ordered, paid, cancelled and refunded. The owner's job is to connect the three without pretending they are interchangeable.
The Revenue Truth Reconciliation Gate
I use six checks before revenue guides an increase, cut or reallocation of advertising budget.
Are dates aligned?
Match date range, time zone, conversion delay and comparison maturity.
Is the event the same?
Confirm each system means a completed purchase—not checkout, lead or modelled proxy.
Can orders deduplicate?
Pass a stable transaction ID and exclude tests, repeats and invalid records.
Is money defined alike?
Align currency, discounts, tax, shipping and product versus order value.
Who receives credit?
Record model, window, channel rules, cross-device treatment and reporting date.
What became business value?
Reconcile paid orders, cancellations, refunds, contribution and customer quality.
The first failed check defines the next investigation. If transaction IDs repeat, fix identity before debating channel quality. If the store ledger includes refunded orders, repair settlement before changing bids. If the systems are internally sound but attribute differently, document the expected gap rather than repeatedly rebuilding tracking.
The Order-to-Investment Evidence Loop
The gate checks reliability. The loop turns reliable evidence into a repeatable investment decision.
Preserve order identity
Collect transaction ID, value, currency, source context and event time.
Use one business definition
Choose gross, net or contribution value and apply it consistently.
Join real records
Compare platform and analytics events with completed commerce orders.
Classify the gap
Separate known attribution, timing, collection and value differences.
Mark confidence
Label reconciled, explainable, under investigation or unreliable evidence.
Allocate with limits
Scale, hold, reduce or repair according to verified business value.
A useful weekly view does not need perfect one-to-one matching. It needs stable definitions, a materiality threshold and an owner for unexplained variance. The monthly view can then incorporate late conversions, refunds and contribution. For the broader question of whether marketing is creating commercial progress, use the owner's marketing evidence guide. If revenue is rising but profit is not, use the ecommerce profit diagnosis.
Turn the gap into one decision
| Evidence pattern | Likely interpretation | Owner decision | Avoid |
|---|---|---|---|
| Stable gap; order matching and definitions are sound | Expected attribution difference | Document it and monitor for material change | Forcing totals to be identical |
| Platform purchases exceed unique completed orders | Possible duplication, invalid event or definition mismatch | Repair IDs and receipt tests before scaling | Optimising to the inflated value |
| Orders exist but analytics misses a changing share | Possible collection, consent or implementation loss | Investigate by device, market and checkout route | Calling the change weaker demand |
| Reported return is strong; contribution is weak | Revenue is hiding product, discount or fulfilment economics | Allocate by reconciled contribution and capacity | Scaling from headline ROAS alone |
| Gap changes after a site or tracking release | Possible measurement discontinuity | Audit the release, annotate the break and restore continuity | Comparing broken periods as normal |
| Records cannot be matched reliably | Insufficient evidence | Hold material budget changes and repair measurement | Picking the most favourable dashboard |
The conversion tracking service connects advertising signals to business outcomes. The Google Ads service uses that evidence in ongoing investment decisions, while case studies show how results are reported with caveats intact. You can also review my operating model and the ecommerce purchase-recovery case analysis.
Practitioner note: the most dangerous discrepancy is not always the largest. A small, stable and explained attribution gap may be harmless. A sudden shift after a checkout change, missing transaction IDs or a rising refunded-order share can be commercially important even when the top-line dashboard still looks strong.
Sources and evidence notes
Sources and current search results were checked on 15 October 2026. Search prioritisation is qualitative; no unverified search volume, universal discrepancy threshold, benchmark, forecast or client result is used. The Revenue Truth Reconciliation Gate, Order-to-Investment Evidence Loop and decision matrix are original ThomPerformance practitioner analysis.
Frequently asked questions
Why is advertising revenue higher than analytics revenue?
The systems may use different attribution rules, conversion windows, reporting dates, consented data and cross-device signals. An advertising platform can claim credit for an order that analytics attributes differently or does not observe. First align the definitions; then reconcile both systems against completed store orders rather than assuming the larger total is correct.
Which revenue number should an ecommerce owner trust?
Use completed commerce or payment records, adjusted for cancellations, refunds, tax, shipping and currency according to the business definition, as the financial anchor. Advertising and analytics reports remain useful for explaining customer acquisition and allocating budget, but neither should replace reconciled order and contribution evidence.
Should Google Ads revenue match Google Analytics revenue exactly?
No. Google explains that its advertising and analytics products can attribute the same key event differently, so totals for the same date range may differ. The goal is not forced equality. The goal is to understand the material gap, verify data integrity and keep investment decisions connected to confirmed business value.
Can duplicate purchases inflate advertising revenue?
Yes. Reused or missing transaction identifiers can allow the same purchase to be counted more than once in a measurement system. A clean order identifier should travel with the purchase event, and duplicate, test, cancelled and refunded orders should be handled consistently before revenue is used for budget decisions.
How often should a business reconcile advertising and store revenue?
Review it on a cadence suited to spend and sales volume—often weekly for operating decisions and monthly for a fuller financial view. Use the same definitions each time, allow for conversion delay, and investigate material changes rather than expecting a universal percentage gap.
Revenue measurement diagnostic
Make the next budget decision from reconciled business value
Share the advertising report, analytics view, commerce export and the decision you need to make. I'll identify whether the gap is expected, explainable, under investigation or unreliable—and what should change before more budget is committed.
Discuss revenue reconciliation